Delta Airlines 2008 Annual Report Download - page 40
Download and view the complete annual report
Please find page 40 of the 2008 Delta Airlines annual report below. You can navigate through the pages in the report by either clicking on the pages listed below, or by using the keyword search tool below to find specific information within the annual report.-
 1
1 -
2
-
3
-
4
-
5
-
6
-
7
-
8
-
9
-
10
-
11
-
12
-
13
-
14
-
15
-
16
-
17
-
18
-
19
-
20
-
21
-
22
-
23
-
24
-
25
-
26
-
27
-
28
-
29
-
 30
30 -
 31
31 -
 32
32 -
 33
33 -
 34
34 -
 35
35 -
 36
36 -
 37
37 -
 38
38 -
 39
39 -
 40
40 -
 41
41 -
 42
42 -
 43
43 -
 44
44 -
 45
45 -
 46
46 -
 47
47 -
 48
48 -
 49
49 -
 50
50 -
51
-
52
-
53
-
54
-
55
-
56
-
57
-
58
-
59
-
60
-
61
-
62
-
63
-
64
-
65
-
66
-
67
-
68
-
69
-
70
-
71
-
72
-
73
-
74
-
75
-
76
-
77
-
78
-
79
-
80
-
81
-
82
-
83
-
84
-
85
-
86
-
87
-
88
-
89
-
90
-
91
-
92
-
93
-
94
-
95
-
96
-
97
-
98
-
99
-
100
-
101
-
102
-
103
-
104
-
105
-
106
-
107
-
108
-
109
-
110
-
111
-
112
-
113
-
114
-
115
-
116
-
117
-
118
-
119
-
120
-
121
-
122
-
123
-
124
-
125
-
126
-
127
-
128
-
129
-
130
-
131
-
132
-
133
-
134
-
135
-
136
-
137
-
138
-
139
-
140
-
141
-
142
-
143
-
144
-
145
-
146
-
147
-
148
-
149
-
150
-
151
-
152
-
153
-
154
-
155
-
156
-
157
-
158
-
159
-
160
-
161
-
162
-
163
-
164
-
165
-
166
-
167
-
168
-
169
-
170
-
171
-
172
-
173
-
174
-
175
-
176
-
177
-
178
-
179
-
180
-
181
-
182
-
183
-
184
-
185
-
186
-
187
-
188
-
189
-
190
-
191
-
192
-
193
-
194
-
195
-
196
-
197
-
198
-
199
-
200
-
201
-
202
-
203
-
204
-
205
-
206
-
207
-
208
 |
 |

Table of Contents
Index to Financial Statements
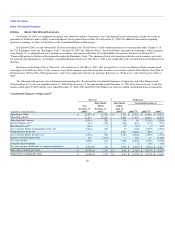
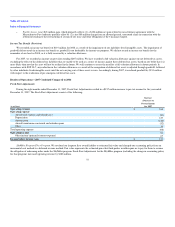
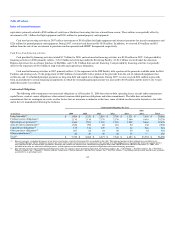
Northwest Operations. As a result of the Merger, 2008 includes Northwest's operations for the period from October 30 to December 31, 2008,
increasing operating expense $2.1 billion. The addition of Northwest for that period increased capacity 10% for the full year.
Restructuring and merger-related items. Restructuring and merger-related items totaled a $1.1 billion charge, primarily consisting of the following:
• Merger-related charges. $978 million in one-time primarily non-cash charges relating to the issuance or vesting of employee equity awards in
connection with the Merger.
• Severance and related costs. $114 million in restructuring and related charges in connection with two voluntary workforce reduction programs
for U.S. non-pilot employees announced in March 2008 in which approximately 4,200 employees elected to participate.
• Facilities and other. $25 million in facilities charges primarily related to accruals for future lease obligations for previously announced plans to
close operations in Concourse C at the Cincinnati Northern Kentucky International Airport (the "Cincinnati Airport").
• Contract carrier restructuring. $14 million in charges associated with the early termination of certain capacity purchase agreements with contract
carriers.
Impairments. During the March 2008 quarter, we experienced a significant decline in market capitalization driven primarily by record fuel prices and
overall airline industry conditions. In addition, the announcement of our intention to merge with Northwest established a stock exchange ratio based on the
relative valuation of Delta and Northwest. As a result of these indicators, we determined goodwill was impaired and recorded a non-cash charge of $6.9
billion. In addition to the goodwill impairment charge, in the June 2008 quarter, we recorded a non-cash charge of $357 million to reduce the carrying value
of certain intangible assets based on their revised estimated fair values.
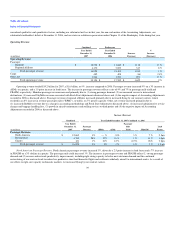
Fuel expense. Fuel expense, including contract carriers, increased $2.2 billion, primarily due to higher average fuel prices, partially offset by fuel hedge
gains and reduced consumption from lower capacity. Fuel prices averaged $3.18 per gallon, including fuel hedge gains of $134 million, for 2008, compared to
$2.24 per gallon, including fuel hedge gains of $51 million, for 2007.
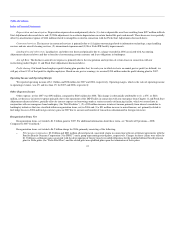
Salaries and related costs. A $109 million increase primarily from a 6% average increase in pilots and flight attendants to staff increased international
flying, annual pay increases for all pilot and non-pilot non-management employees, and increases in group insurance rates, partially offset by a 3% average
decrease in headcount primarily related to two voluntary workforce reduction programs.
Aircraft maintenance materials and outside repairs. A $73 million increase primarily due to growth in our third party maintenance and repair business.
Passenger service. A $67 million increase primarily associated with (1) the increased cost of catering on international flights, (2) product upgrades in
our Business Elite cabins and (3) unfavorable foreign currency exchange rates.
Profit sharing. A $158 million charge related to our broad-based employee profit sharing plan in 2007. We did not record any profit sharing expense in
2008. This plan provides that, for each year in which we have an annual pre-tax profit (as defined), we will pay at least 15% of that profit to eligible
employees.
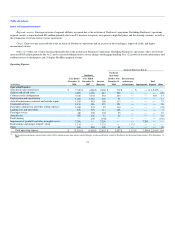
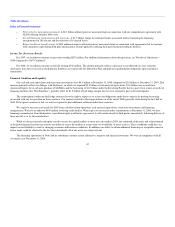
Operating Income and Operating Margin
We reported an operating loss of $8.3 billion for 2008 and operating income of $1.1 billion for 2007. Operating margin, which is the ratio of operating
(loss) income to operating revenues, was (37)% and 6% for 2008 and 2007, respectively.
35