Delta Airlines 2008 Annual Report Download - page 34
Download and view the complete annual report
Please find page 34 of the 2008 Delta Airlines annual report below. You can navigate through the pages in the report by either clicking on the pages listed below, or by using the keyword search tool below to find specific information within the annual report.-
 1
1 -
2
-
3
-
4
-
5
-
6
-
7
-
8
-
9
-
10
-
11
-
12
-
13
-
14
-
15
-
16
-
17
-
18
-
19
-
20
-
21
-
22
-
23
-
 24
24 -
 25
25 -
 26
26 -
 27
27 -
 28
28 -
 29
29 -
 30
30 -
 31
31 -
 32
32 -
 33
33 -
 34
34 -
 35
35 -
 36
36 -
 37
37 -
 38
38 -
 39
39 -
 40
40 -
 41
41 -
 42
42 -
 43
43 -
 44
44 -
45
-
46
-
47
-
48
-
49
-
50
-
51
-
52
-
53
-
54
-
55
-
56
-
57
-
58
-
59
-
60
-
61
-
62
-
63
-
64
-
65
-
66
-
67
-
68
-
69
-
70
-
71
-
72
-
73
-
74
-
75
-
76
-
77
-
78
-
79
-
80
-
81
-
82
-
83
-
84
-
85
-
86
-
87
-
88
-
89
-
90
-
91
-
92
-
93
-
94
-
95
-
96
-
97
-
98
-
99
-
100
-
101
-
102
-
103
-
104
-
105
-
106
-
107
-
108
-
109
-
110
-
111
-
112
-
113
-
114
-
115
-
116
-
117
-
118
-
119
-
120
-
121
-
122
-
123
-
124
-
125
-
126
-
127
-
128
-
129
-
130
-
131
-
132
-
133
-
134
-
135
-
136
-
137
-
138
-
139
-
140
-
141
-
142
-
143
-
144
-
145
-
146
-
147
-
148
-
149
-
150
-
151
-
152
-
153
-
154
-
155
-
156
-
157
-
158
-
159
-
160
-
161
-
162
-
163
-
164
-
165
-
166
-
167
-
168
-
169
-
170
-
171
-
172
-
173
-
174
-
175
-
176
-
177
-
178
-
179
-
180
-
181
-
182
-
183
-
184
-
185
-
186
-
187
-
188
-
189
-
190
-
191
-
192
-
193
-
194
-
195
-
196
-
197
-
198
-
199
-
200
-
201
-
202
-
203
-
204
-
205
-
206
-
207
-
208
 |
 |
Table of Contents
Index to Financial Statements
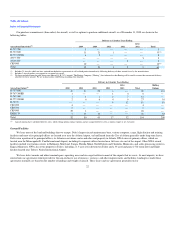
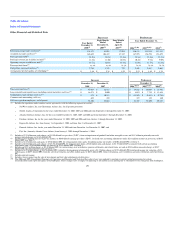
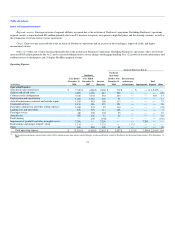
Other Financial and Statistical Data
Successor Predecessor
Year Ended
December 31,
2008(2)
Eight Months
Ended
December 31,
2007(3)
Four Months
Ended
April 30,
2007(4)
Year Ended December 31,
2006(5)(10) 2005(6)(10) 2004(7)
Revenue passenger miles (millions)(1) 134,879 85,029 37,036 116,133 119,954 113,311
Available seat miles (millions)(1) 165,639 104,427 47,337 147,995 156,793 151,679
Passenger mile yield(1) 14.52¢ 13.88¢ 13.84¢ 13.34¢ 12.16¢ 12.17¢
Passenger revenue per available seat mile(1) 11.82¢ 11.30¢ 10.83¢ 10.47¢ 9.31¢ 9.09¢
Operating cost per available seat mile(1) 18.72¢ 12.03¢ 11.61¢ 11.80¢ 11.79¢ 12.23¢
Passenger load factor(1) 81.4% 81.4% 78.2% 78.5% 76.5% 74.7%
Fuel gallons consumed (millions)(1) 2,740 1,742 792 2,480 2,687 2,665
Average price per fuel gallon, net of hedging(1) $ 3.16 $ 2.38 $ 1.93 $ 2.12 $ 1.89 $ 1.31
Successor Predecessor
December 31,
2008
December 31,
2007
December 31,
2006(4)(10) 2005(5)(10) 2004(6)
Total assets (millions)(1) $ 45,014 $ 32,423 $ 19,622 $ 20,039 $ 21,801
Long-term debt and capital leases (including current maturities) (millions)(1) $ 16,571 $ 9,000 $ 8,012 $ 7,743 $ 13,898
Stockholders' equity (deficit) (millions)(1) $ 874 $ 10,113 $ (13,593) $ (9,895) $ (5,796)
Common stock outstanding (millions) 695 292 197 189 140
Full-time equivalent employees, end of period 84,306 55,044 51,322 55,650 69,148
(1) Includes the operations under contract carrier agreements with the following regional air carriers:
• SkyWest Airlines, Inc. and Chautauqua Airlines, Inc. for all periods presented;
• Shuttle America Corporation for the years ended December 31, 2008, 2007 and 2006 and from September 1 through December 31, 2005;
• Atlantic Southeast Airlines, Inc. for the years ended December 31, 2008, 2007 and 2006 and from September 8 through December 31, 2005;
• Freedom Airlines, Inc. for the years ended December 31, 2008, 2007 and 2006 and from October 1 through December 31, 2005;
• ExpressJet Airlines, Inc. from January 1 to September 1, 2008 and from June 1 to December 31, 2007;
• Pinnacle Airlines, Inc. for the year ended December 31, 2008 and from December 1 to December 31, 2007; and
• Flyi, Inc. (formerly Atlantic Coast Airlines) from January 1, 2003 through November 1, 2004.
(2) Includes a $7.3 billion non-cash charge, or $15.59 diluted loss per share ("LPS"), from an impairment of goodwill and other intangible assets and $1.1 billion in primarily non-cash
merger-related charges, or $2.42 diluted LPS.
(3) Includes a $157 million increase to pre-tax income, or $0.40 diluted earnings per share ("EPS"), for fresh start accounting adjustments and a $211 million income tax provision, or $0.53
diluted EPS (see Item 7).
(4) Includes a $1.2 billion non-cash gain, or $5.20 diluted EPS, for reorganization items and a $4 million income tax benefit, or $0.02 diluted EPS (see Item 7).
(5) Includes a $6.2 billion non-cash charge, or $31.58 diluted EPS, for reorganization items a $310 million non-cash charge, or $1.58 diluted LPS associated with certain accounting
adjustments and a $765 million income tax benefit, or $3.89 diluted EPS (see Item 7).
(6) Includes an $888 million charge, or $5.49 diluted LPS, for restructuring, asset writedowns, pension settlements and related items, net and an $884 million non-cash charge, or $5.47
diluted LPS, for reorganization costs (see Item 7).
(7) Includes a $1.9 billion charge, or $14.76 diluted LPS, related to the impairment of intangible assets a $1.2 billion charge, or $9.51 diluted LPS for deferred income tax valuation a $123
million gain, or $0.97 diluted EPS, from the sale of investments and a $41 million gain, or $0.33 diluted EPS, from restructuring, asset writedowns, pension settlements and related items,
net.
(8) Includes interest income.
(9) Includes (losses) gains from the sale of investments and fair value adjustments of derivatives.
(10) The 2006 and 2005 Consolidated Summary of Operations and Financial and Statistical Data above have been updated to conform to current period presentation for certain
reclassifications made upon emergence from bankruptcy. These changes have no impact on operating or net income in any period prior or subsequent to our emergence from bankruptcy.
29