Delta Airlines 2008 Annual Report Download - page 107
Download and view the complete annual report
Please find page 107 of the 2008 Delta Airlines annual report below. You can navigate through the pages in the report by either clicking on the pages listed below, or by using the keyword search tool below to find specific information within the annual report.-
 1
1 -
2
-
3
-
4
-
5
-
6
-
7
-
8
-
9
-
10
-
11
-
12
-
13
-
14
-
15
-
16
-
17
-
18
-
19
-
20
-
21
-
22
-
23
-
24
-
25
-
26
-
27
-
28
-
29
-
30
-
31
-
32
-
33
-
34
-
35
-
36
-
37
-
38
-
39
-
40
-
41
-
42
-
43
-
44
-
45
-
46
-
47
-
48
-
49
-
50
-
51
-
52
-
53
-
54
-
55
-
56
-
57
-
58
-
59
-
60
-
61
-
62
-
63
-
64
-
65
-
66
-
67
-
68
-
69
-
70
-
71
-
72
-
73
-
74
-
75
-
76
-
77
-
78
-
79
-
80
-
81
-
82
-
83
-
84
-
85
-
86
-
87
-
88
-
89
-
90
-
91
-
92
-
93
-
94
-
95
-
96
-
 97
97 -
 98
98 -
 99
99 -
 100
100 -
 101
101 -
 102
102 -
 103
103 -
 104
104 -
 105
105 -
 106
106 -
 107
107 -
 108
108 -
 109
109 -
 110
110 -
 111
111 -
 112
112 -
 113
113 -
 114
114 -
 115
115 -
 116
116 -
 117
117 -
118
-
119
-
120
-
121
-
122
-
123
-
124
-
125
-
126
-
127
-
128
-
129
-
130
-
131
-
132
-
133
-
134
-
135
-
136
-
137
-
138
-
139
-
140
-
141
-
142
-
143
-
144
-
145
-
146
-
147
-
148
-
149
-
150
-
151
-
152
-
153
-
154
-
155
-
156
-
157
-
158
-
159
-
160
-
161
-
162
-
163
-
164
-
165
-
166
-
167
-
168
-
169
-
170
-
171
-
172
-
173
-
174
-
175
-
176
-
177
-
178
-
179
-
180
-
181
-
182
-
183
-
184
-
185
-
186
-
187
-
188
-
189
-
190
-
191
-
192
-
193
-
194
-
195
-
196
-
197
-
198
-
199
-
200
-
201
-
202
-
203
-
204
-
205
-
206
-
207
-
208
 |
 |
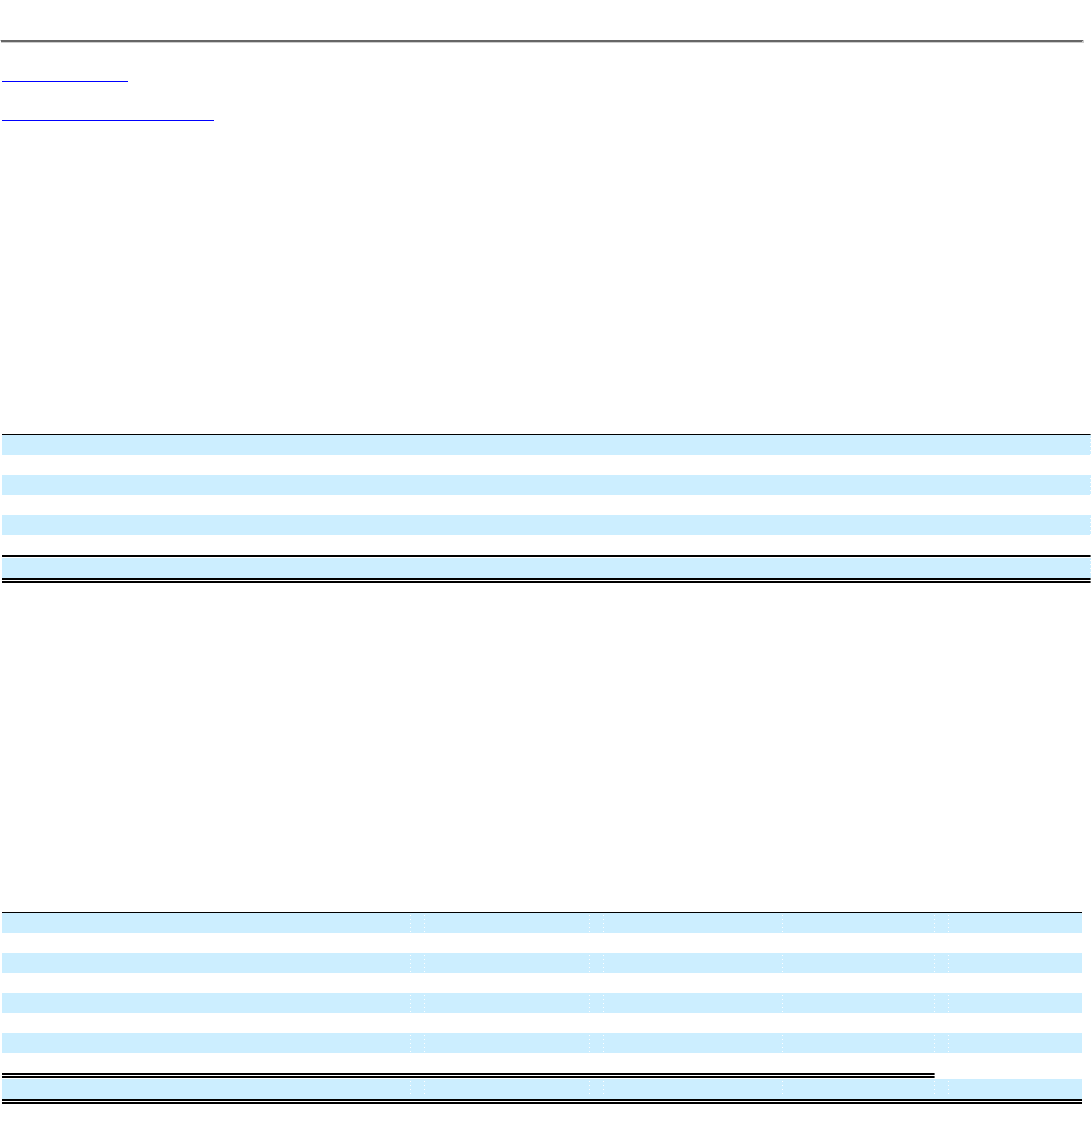
Table of Contents
Index to Financial Statements
NOTES TO THE CONSOLIDATED FINANCIAL STATEMENTS—(Continued)
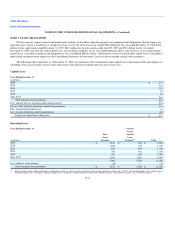
Capacity Purchase Agreements. During the year ended December 31, 2008, seven Contract Carriers operated for us (in addition to Comair, Compass
and Mesaba) pursuant to capacity purchase agreements. Under these agreements, the Contract Carriers operate some or all of their aircraft using our flight
designator codes, and we control the scheduling, pricing, reservations, ticketing and seat inventories of those aircraft and retain the revenues associated with
those flights. We pay those airlines an amount, as defined in the applicable agreement, which is based on a determination of their cost of operating those
flights and other factors intended to approximate market rates for those services.
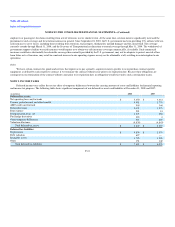
The following table shows our minimum fixed obligations under these capacity purchase agreements (excluding Comair, Compass and Mesaba). The
obligations set forth in the table contemplate minimum levels of flying by the Contract Carriers under the respective agreements and also reflect assumptions
regarding certain costs associated with the minimum levels of flying such as for fuel, labor, maintenance, insurance, catering, property tax and landing fees.
Accordingly, our actual payments under these agreements could differ materially from the minimum fixed obligations set forth in the table below.
Year Ending December 31,
(in millions) Amount(1)
2009 $ 2,130
2010 2,130
2011 2,170
2012 2,130
2013 2,060
After 2013 9,610
Total $ 20,230
(1) These amounts exclude contract carrier lease payments accounted for as operating leases, which are described in Note 7. The contingencies described below under "Contingencies Related
to Termination of Contract Carrier Agreements" are not included in this table.
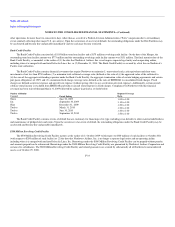
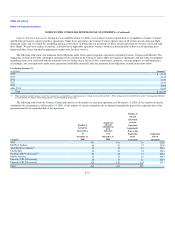
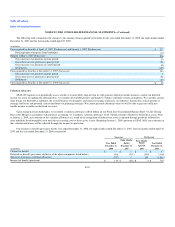
The following table shows by Contract Carrier and contract (1) the number of aircraft in operation as of December 31, 2008, (2) the number of aircraft
scheduled to be in operation as of December 31, 2009, (3) the number of aircraft scheduled to be in operation immediately prior to the expiration date of the
agreement and (4) the expiration date of the agreement:
Carrier(1)
Number of
Aircraft in
Operation as
of
December 31,
2008
Number of
Aircraft
Scheduled to
be in
Operation
as of
December 31,
2009
Number of
Aircraft
Scheduled
to be in
Operation
Immediately
Prior to the
Expiration
of the
Agreement
Expiration
Date of
Agreement
ASA 141 141 16 2020
SkyWest Airlines 80 82 37 2020
ASA/SkyWest Airlines(1) 12 12 12 2012
Chautauqua 24 24 24 2016
Freedom (ERJ-145 aircraft)(2) 28 28 22 2012
Shuttle America 16 16 16 2019
Pinnacle (CRJ-900 aircraft) 18 16 16 2019
Pinnacle (CRJ-200 aircraft) 124 124 124 2017
Total 443 443 267
F-37