Delta Airlines 2008 Annual Report Download - page 93
Download and view the complete annual report
Please find page 93 of the 2008 Delta Airlines annual report below. You can navigate through the pages in the report by either clicking on the pages listed below, or by using the keyword search tool below to find specific information within the annual report.-
 1
1 -
2
-
3
-
4
-
5
-
6
-
7
-
8
-
9
-
10
-
11
-
12
-
13
-
14
-
15
-
16
-
17
-
18
-
19
-
20
-
21
-
22
-
23
-
24
-
25
-
26
-
27
-
28
-
29
-
30
-
31
-
32
-
33
-
34
-
35
-
36
-
37
-
38
-
39
-
40
-
41
-
42
-
43
-
44
-
45
-
46
-
47
-
48
-
49
-
50
-
51
-
52
-
53
-
54
-
55
-
56
-
57
-
58
-
59
-
60
-
61
-
62
-
63
-
64
-
65
-
66
-
67
-
68
-
69
-
70
-
71
-
72
-
73
-
74
-
75
-
76
-
77
-
78
-
79
-
80
-
81
-
82
-
 83
83 -
 84
84 -
 85
85 -
 86
86 -
 87
87 -
 88
88 -
 89
89 -
 90
90 -
 91
91 -
 92
92 -
 93
93 -
 94
94 -
 95
95 -
 96
96 -
 97
97 -
 98
98 -
 99
99 -
 100
100 -
 101
101 -
 102
102 -
 103
103 -
104
-
105
-
106
-
107
-
108
-
109
-
110
-
111
-
112
-
113
-
114
-
115
-
116
-
117
-
118
-
119
-
120
-
121
-
122
-
123
-
124
-
125
-
126
-
127
-
128
-
129
-
130
-
131
-
132
-
133
-
134
-
135
-
136
-
137
-
138
-
139
-
140
-
141
-
142
-
143
-
144
-
145
-
146
-
147
-
148
-
149
-
150
-
151
-
152
-
153
-
154
-
155
-
156
-
157
-
158
-
159
-
160
-
161
-
162
-
163
-
164
-
165
-
166
-
167
-
168
-
169
-
170
-
171
-
172
-
173
-
174
-
175
-
176
-
177
-
178
-
179
-
180
-
181
-
182
-
183
-
184
-
185
-
186
-
187
-
188
-
189
-
190
-
191
-
192
-
193
-
194
-
195
-
196
-
197
-
198
-
199
-
200
-
201
-
202
-
203
-
204
-
205
-
206
-
207
-
208
 |
 |
Table of Contents
Index to Financial Statements
NOTES TO THE CONSOLIDATED FINANCIAL STATEMENTS—(Continued)
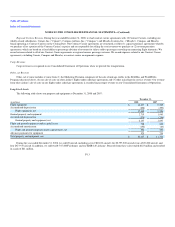
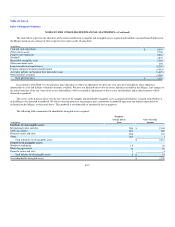
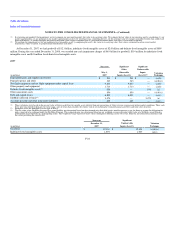
Assets and Liabilities Measured at Fair Value on a Nonrecurring Basis
2008
Assets Acquired and Liabilities Assumed from Northwest
(in millions)
October 29,
2008
Significant
Other
Observable
Inputs (Level 2)
Significant
Unobservable
Inputs
(Level 3)(1)
Valuation
Technique
Flight equipment $ 7,954 $ 7,954 $ — (a)
Other property and equipment 598 598 — (a)(b)
Goodwill(2) 4,572 — 4,572 (a)(b)(c)
Indefinite-lived intangible assets(2) 2,631 — 2,631 (a)(c)
Definite-lived intangible assets(2) 71 — 71 (c)
Other noncurrent assets 261 181 80 (a)(b)
Debt and capital leases 6,239 6,239 — (a)(c)
WorldPerks deferred revenue(3) 2,034 — 2,034 (a)
Other noncurrent liabilities 224 224 — (a)
(1) These valuations were based on the present value of future cash flows for specific assets derived from our projections of future revenue, expense and airline market conditions. These cash
flows were discounted to their present value using a rate of return that considers the relative risk of not realizing the estimated annual cash flows and time value of money.
(2) Goodwill represents the excess of purchase price over the fair value of the tangible and identifiable intangible assets acquired and liabilities assumed from Northwest in the Merger.
Indefinite-lived and definite-lived intangible assets are identified by type in Note 5. Fair value measurements for goodwill and other intangible assets included significant unobservable
inputs which generally include a five-year business plan, 12-months of historical revenues and expenses by city pair, projections of available seat miles, revenue passenger miles, load
factors, and operating costs per available seat mile and a discount rate.
One of the significant unobservable inputs underlying the intangible fair value measurements performed on the Closing Date is the discount rate. We determined the discount rate using
the weighted average cost of capital of the airline industry, which was measured using a Capital Asset Pricing Model ("CAPM"). The CAPM in the valuation of goodwill and indefinite-
lived intangibles utilizing a 50% debt and 50% equity structure. The historical average debt-to-equity structure of the major airlines since 1990 is also approximately 50% debt and 50%
equity, which was similar to Northwest's debt-to-equity structure at emergence from Chapter 11. The return on debt was measured using a bid-to-yield analysis of major airline corporate
bonds. The expected market rate of return for equity was measured based on the risk free rate, the airline industry beta, and risk premiums based on the Federal Reserve Statistical Release
H. 15 or Ibbotson® Stocks, Bonds, Bills, and Inflation® Valuation Yearbook, Edition 2008. These factors resulted in a 13% discount rate. This compares to an 11% discount rate used at
emergence by Northwest.
(3) The fair value of Northwest's WorldPerks Program liability was determined based on the estimated price that third parties would require us to pay for them to assume the obligation for
miles expected to be redeemed under the WorldPerks Program. This estimated price was determined based on the weighted-average equivalent ticket value of a WorldPerks award which
is redeemed for travel on Northwest, Delta or a participating airline. The weighted-average equivalent ticket value contemplates differing classes of service, domestic and international
itineraries and the carrier providing the award travel.
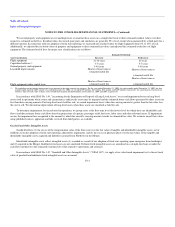
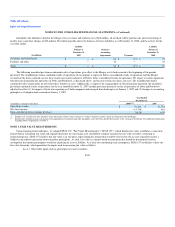
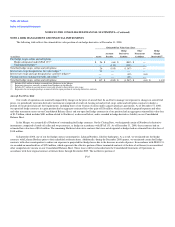
Goodwill and Other Intangible Assets at December 31, 2008
(in millions)
December 31,
2008
Significant
Unobservable
Inputs (Level 3)
Total
Impairment
Valuation
Technique
Goodwill(1) $ 9,731 $ 9,731 $ 6,939 (a)(b)(c)
Indefinite-lived intangible assets(2) 4,314 4,314 314 (a)(c)
Definite-lived intangible assets 630 630 43 (c)
F-23