Delta Airlines 2008 Annual Report Download - page 170
Download and view the complete annual report
Please find page 170 of the 2008 Delta Airlines annual report below. You can navigate through the pages in the report by either clicking on the pages listed below, or by using the keyword search tool below to find specific information within the annual report.-
 1
1 -
 2
2 -
 3
3 -
 4
4 -
 5
5 -
 6
6 -
 7
7 -
 8
8 -
 9
9 -
 10
10 -
 11
11 -
 12
12 -
 13
13 -
 14
14 -
 15
15 -
 16
16 -
 17
17 -
 18
18 -
 19
19 -
 20
20 -
 21
21 -
 22
22 -
 23
23 -
 24
24 -
 25
25 -
 26
26 -
 27
27 -
 28
28 -
 29
29 -
 30
30 -
 31
31 -
 32
32 -
 33
33 -
 34
34 -
 35
35 -
 36
36 -
 37
37 -
 38
38 -
 39
39 -
 40
40 -
 41
41 -
 42
42 -
 43
43 -
 44
44 -
 45
45 -
 46
46 -
 47
47 -
 48
48 -
 49
49 -
 50
50 -
 51
51 -
 52
52 -
 53
53 -
 54
54 -
 55
55 -
 56
56 -
 57
57 -
 58
58 -
 59
59 -
 60
60 -
 61
61 -
 62
62 -
 63
63 -
 64
64 -
 65
65 -
 66
66 -
 67
67 -
 68
68 -
 69
69 -
 70
70 -
 71
71 -
 72
72 -
 73
73 -
 74
74 -
 75
75 -
 76
76 -
 77
77 -
 78
78 -
 79
79 -
 80
80 -
 81
81 -
 82
82 -
 83
83 -
 84
84 -
 85
85 -
 86
86 -
 87
87 -
 88
88 -
 89
89 -
 90
90 -
 91
91 -
 92
92 -
 93
93 -
 94
94 -
 95
95 -
 96
96 -
 97
97 -
 98
98 -
 99
99 -
 100
100 -
 101
101 -
 102
102 -
 103
103 -
 104
104 -
 105
105 -
 106
106 -
 107
107 -
 108
108 -
 109
109 -
 110
110 -
 111
111 -
 112
112 -
 113
113 -
 114
114 -
 115
115 -
 116
116 -
 117
117 -
 118
118 -
 119
119 -
 120
120 -
 121
121 -
 122
122 -
 123
123 -
 124
124 -
 125
125 -
 126
126 -
 127
127 -
 128
128 -
 129
129 -
 130
130 -
 131
131 -
 132
132 -
 133
133 -
 134
134 -
 135
135 -
 136
136 -
 137
137 -
 138
138 -
 139
139 -
 140
140 -
 141
141 -
 142
142 -
 143
143 -
 144
144 -
 145
145 -
 146
146 -
 147
147 -
 148
148 -
 149
149 -
 150
150 -
 151
151 -
 152
152 -
 153
153 -
 154
154 -
 155
155 -
 156
156 -
 157
157 -
 158
158 -
 159
159 -
 160
160 -
 161
161 -
 162
162 -
 163
163 -
 164
164 -
 165
165 -
 166
166 -
 167
167 -
 168
168 -
 169
169 -
 170
170 -
 171
171 -
 172
172 -
 173
173 -
 174
174 -
 175
175 -
 176
176 -
 177
177 -
 178
178 -
 179
179 -
 180
180 -
 181
181 -
 182
182 -
 183
183 -
 184
184 -
 185
185 -
 186
186 -
 187
187 -
 188
188 -
 189
189 -
 190
190 -
 191
191 -
 192
192 -
 193
193 -
 194
194 -
 195
195 -
 196
196 -
 197
197 -
 198
198 -
 199
199 -
 200
200 -
 201
201 -
 202
202 -
 203
203 -
 204
204 -
 205
205 -
 206
206 -
 207
207 -
 208
208
 |
 |

Performance Measures and Weighting
Employment
Level
(A)
% of Target
MIP Award
allocated to
Financial
Performance
(B)
% of Target
MIP Award
allocated to
Operational
Performance
(C)
% of Target
MIP Award
Allocated to
Merger
Integration
Performance
(D)
% of Target
MIP Award
allocated to
Leadership
Effectiveness
Performance
(E)
% of Target
MIP Award
allocated to
Individual
Performance
(F)
CEO 33% 33% 34% 0% 0%
President 33% 33% 34% 0% 0%
EVP 33% 33% 34% 0% 0%
SVP 30% 30% 30% 10% 0%
VP 30% 30% 30% 10% 0%
Managing Director 30% 30% 0% 0% 40%
Director 30% 30% 0% 0% 40%
Grade 11 25% 25% 0% 0% 50%
Grade 10 0% 0% 0% 0% 100%
Grade 8 0% 0% 0% 0% 100%
6. The Performance Measures—Threshold, Target and Maximum Payout Levels. The Target MIP Award, and the amounts paid in connection with
target levels of Financial, Operational, Merger Integration, Leadership Effectiveness, and Individual Performance, are based on the achievement of the target
performance level with respect to each applicable performance measure (except that Financial Performance also requires a payout under the Profit Sharing
Program for 2009). A Participant's actual MIP Award may be greater or less than the target amount based on whether performance under one or more of the
performance measures applicable to the Participant exceeds or is below target performance. This is explained in more detail below.
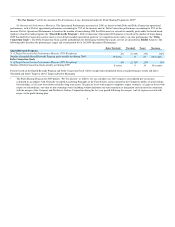
(a) Financial Performance Measures. The Financial Performance measures for 2009 are based on Delta's Pre-Tax Income, as defined below. The
following table describes the performance ranges and award payout levels for 2009 Financial Performance, subject to Section 4(c) above:
Threshold Target Maximum
% of Target Financial Performance Measure Paid 50% 100% 200%
Required 2009 Pre-Tax Income $ 856 million $ 1.278 billion $ 1.700 billion
Payouts will be straight-line interpolated when Pre-Tax Income results fall above Threshold and below Target or above Target and below Maximum.
3
