Delta Airlines 2008 Annual Report Download - page 130
Download and view the complete annual report
Please find page 130 of the 2008 Delta Airlines annual report below. You can navigate through the pages in the report by either clicking on the pages listed below, or by using the keyword search tool below to find specific information within the annual report.-
 1
1 -
2
-
3
-
4
-
5
-
6
-
7
-
8
-
9
-
10
-
11
-
12
-
13
-
14
-
15
-
16
-
17
-
18
-
19
-
20
-
21
-
22
-
23
-
24
-
25
-
26
-
27
-
28
-
29
-
30
-
31
-
32
-
33
-
34
-
35
-
36
-
37
-
38
-
39
-
40
-
41
-
42
-
43
-
44
-
45
-
46
-
47
-
48
-
49
-
50
-
51
-
52
-
53
-
54
-
55
-
56
-
57
-
58
-
59
-
60
-
61
-
62
-
63
-
64
-
65
-
66
-
67
-
68
-
69
-
70
-
71
-
72
-
73
-
74
-
75
-
76
-
77
-
78
-
79
-
80
-
81
-
82
-
83
-
84
-
85
-
86
-
87
-
88
-
89
-
90
-
91
-
92
-
93
-
94
-
95
-
96
-
97
-
98
-
99
-
100
-
101
-
102
-
103
-
104
-
105
-
106
-
107
-
108
-
109
-
110
-
111
-
112
-
113
-
114
-
115
-
116
-
117
-
118
-
119
-
 120
120 -
 121
121 -
 122
122 -
 123
123 -
 124
124 -
 125
125 -
 126
126 -
 127
127 -
 128
128 -
 129
129 -
 130
130 -
 131
131 -
 132
132 -
 133
133 -
 134
134 -
 135
135 -
 136
136 -
 137
137 -
 138
138 -
 139
139 -
 140
140 -
141
-
142
-
143
-
144
-
145
-
146
-
147
-
148
-
149
-
150
-
151
-
152
-
153
-
154
-
155
-
156
-
157
-
158
-
159
-
160
-
161
-
162
-
163
-
164
-
165
-
166
-
167
-
168
-
169
-
170
-
171
-
172
-
173
-
174
-
175
-
176
-
177
-
178
-
179
-
180
-
181
-
182
-
183
-
184
-
185
-
186
-
187
-
188
-
189
-
190
-
191
-
192
-
193
-
194
-
195
-
196
-
197
-
198
-
199
-
200
-
201
-
202
-
203
-
204
-
205
-
206
-
207
-
208
 |
 |
Table of Contents
Index to Financial Statements
NOTES TO THE CONSOLIDATED FINANCIAL STATEMENTS—(Continued)
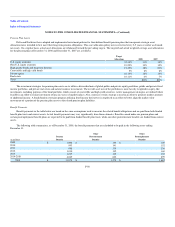
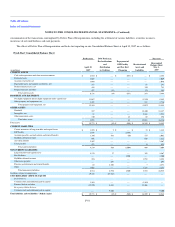
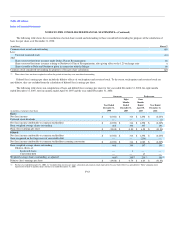
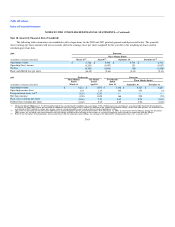
Note 13. Accumulated Other Comprehensive (Loss) Income
The following table shows the components of accumulated other comprehensive (loss) income for the year ended December 31, 2008, the eight months
ended December 31, 2007, the four months ended April 30, 2007 and the year ended December 31, 2006:
(in millions)
Additional
Minimum
Pension
Liability
Unrecognized
Pension
Liability
Derivative
Instruments
Marketable
Equity
Securities
Valuation
Allowance Total
Balance at January 1, 2006
(Predecessor) $ (2,553) $ — $ — $ 1 $ (170) $ (2,722)
Termination of Pilot Plan 2,264 — — — — 2,264
Additional minimum pension liability adjustments 257 — — — — 257
Changes in fair value — — (131) 1 — (130)
Reclassification to earnings — — 108 — — 108
Tax effect (958) — — — 239 (719)
Net of tax 1,563 — (23) 1 239 1,780
Adoption of SFAS 158 990 (727) — — 161 424
Balance at December 31, 2006 (Predecessor) — (727) (23) 2 230 (518)
Pension adjustment — 6 — — — 6
Changes in fair value — — 61 — — 61
Reclassification to earnings — — 8 — — 8
Balance at April 30, 2007
(Predecessor) — (721) 46 2 230 (443)
Elimination of Predecessor other comprehensive loss — 721 (46) (2) (230) 443
Pension adjustment — 408 — — — 408
Changes in fair value — — 86 — — 86
Reclassification to earnings — — (59) — — (59)
Tax effect — (155) (11) — 166 —
Balance at December 31, 2007 (Successor) — 253 16 — 166 435
Pension adjustment — (3,111) — — — (3,111)
Changes in fair value — — (1,369) (9) — (1,378)
Reclassification to earnings — — (26) — — (26)
Tax effect — 1,162 516 3 (1,681) —
Balance at December 31, 2008 (Successor) $ — $ (1,696) $ (863) $ (6) $ (1,515) $ (4,080)
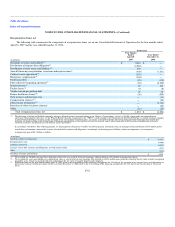
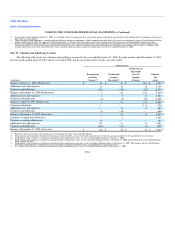
Note 14. Geographic Information
SFAS No. 131, "Disclosures about Segments of an Enterprise and Related Information," requires us to disclose certain information about our operating
segments. Operating segments are defined as components of an enterprise with separate financial information which are evaluated regularly by the chief
operating decision maker and are used in resource allocation and performance assessments.
F-60