Delta Airlines 2008 Annual Report Download - page 76
Download and view the complete annual report
Please find page 76 of the 2008 Delta Airlines annual report below. You can navigate through the pages in the report by either clicking on the pages listed below, or by using the keyword search tool below to find specific information within the annual report.-
 1
1 -
2
-
3
-
4
-
5
-
6
-
7
-
8
-
9
-
10
-
11
-
12
-
13
-
14
-
15
-
16
-
17
-
18
-
19
-
20
-
21
-
22
-
23
-
24
-
25
-
26
-
27
-
28
-
29
-
30
-
31
-
32
-
33
-
34
-
35
-
36
-
37
-
38
-
39
-
40
-
41
-
42
-
43
-
44
-
45
-
46
-
47
-
48
-
49
-
50
-
51
-
52
-
53
-
54
-
55
-
56
-
57
-
58
-
59
-
60
-
61
-
62
-
63
-
64
-
65
-
 66
66 -
 67
67 -
 68
68 -
 69
69 -
 70
70 -
 71
71 -
 72
72 -
 73
73 -
 74
74 -
 75
75 -
 76
76 -
 77
77 -
 78
78 -
 79
79 -
 80
80 -
 81
81 -
 82
82 -
 83
83 -
 84
84 -
 85
85 -
 86
86 -
87
-
88
-
89
-
90
-
91
-
92
-
93
-
94
-
95
-
96
-
97
-
98
-
99
-
100
-
101
-
102
-
103
-
104
-
105
-
106
-
107
-
108
-
109
-
110
-
111
-
112
-
113
-
114
-
115
-
116
-
117
-
118
-
119
-
120
-
121
-
122
-
123
-
124
-
125
-
126
-
127
-
128
-
129
-
130
-
131
-
132
-
133
-
134
-
135
-
136
-
137
-
138
-
139
-
140
-
141
-
142
-
143
-
144
-
145
-
146
-
147
-
148
-
149
-
150
-
151
-
152
-
153
-
154
-
155
-
156
-
157
-
158
-
159
-
160
-
161
-
162
-
163
-
164
-
165
-
166
-
167
-
168
-
169
-
170
-
171
-
172
-
173
-
174
-
175
-
176
-
177
-
178
-
179
-
180
-
181
-
182
-
183
-
184
-
185
-
186
-
187
-
188
-
189
-
190
-
191
-
192
-
193
-
194
-
195
-
196
-
197
-
198
-
199
-
200
-
201
-
202
-
203
-
204
-
205
-
206
-
207
-
208
 |
 |

Table of Contents
Index to Financial Statements
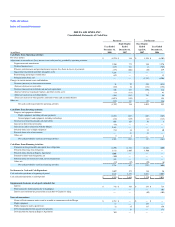
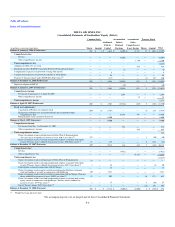
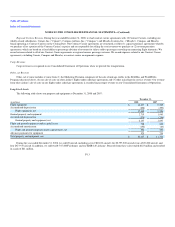
DELTA AIR LINES, INC.
Consolidated Statements of Stockholders' Equity (Deficit)
(in millions, except per share data)
Common Stock
Additional
Paid-In
Capital
(Accumulated
Deficit)
Retained
Earnings
Accumulated
Other
Comprehensive
(Loss) Income
Treasury Stock
Total
Shares Amount Shares Amount
Balance at January 1, 2006 (Predecessor) 202 $ 2 $ 1,635 $ (8,209) $ (2,722) 13 $ (601) $ (9,895)
Comprehensive loss:
Net loss — — — (6,203) — — — (6,203)
Other comprehensive income — — — — 1,780 — — 1,780
Total comprehensive loss (4,423)
Adoption of SFAS 158, net of tax — — — — 424 — — 424
Dividends on Series B ESOP Convertible Preferred Stock allocated shares — — — (2) — — — (2)
Compensation expense associated with vesting stock options — — 8 — — — — 8
Compensation expense associated with rejection of stock options — — 55 — — — — 55
Transfer of Treasury shares under ESOP ($47.20 per share)(1) — — (137) — — (8) 377 240
Balance at December 31, 2006 (Predecessor) 202 2 1,561 (14,414) (518) 5 (224) (13,593)
Impact of adoption of FIN 48 — — — (30) — — — (30)
Balance at January 1, 2007 (Predecessor) 202 2 1,561 (14,444) (518) 5 (224) (13,623)
Comprehensive income:
Net income from January 1 to April 30, 2007 — — — 1,298 — — — 1,298
Other comprehensive income — — — — 75 — — 75
Total comprehensive income 1,373
Balance at April 30, 2007 (Predecessor) 202 2 1,561 (13,146) (443) 5 (224) (12,250)
Fresh start adjustments:
Cancellation of Predecessor common stock (202) (2) (1,561) — — (5) 224 (1,339)
Elimination of Predecessor accumulated deficit and accumulated other
comprehensive loss — — — 13,146 443 — — 13,589
Reorganization value ascribed to Successor — — 9,400 — — — — 9,400
Balance at May 1, 2007 (Successor) — — 9,400 — — — — 9,400
Comprehensive income:
Net income from May 1 to December 31, 2007 — — — 314 — — 314
Other comprehensive income — — — — 435 — 435
Total comprehensive income 749
Shares of common stock issued pursuant to Delta's Plan of Reorganization
(Treasury shares withheld for payment of taxes, $20.32 per share)(1) 278 — — — — 1 (20) (20)
Shares of common stock issued and compensation expense associated with equity
awards (Treasury shares withheld for payment of taxes, $20.56 per share)(1) 21 — 112 — — 6 (128) (16)
Balance at December 31, 2007 (Successor) 299 — 9,512 314 435 7 (148) 10,113
Comprehensive loss:
Net loss — — — (8,922) — — — (8,922)
Other comprehensive loss — — — — (4,515) — — (4,515)
Total comprehensive loss (13,437)
Shares of common stock issued pursuant to Delta's Plan of Reorganization 19 — — — — — — —
Shares of common stock issued and compensation expense associated with equity
awards (Treasury shares withheld for payment of taxes, $10.73 per share)(1) 1 — 54 — — — (4) 50
Stock options assumed in connection with the Merger — — 18 — — — — 18
Shares of common stock issued or issuable in exchange for Northwest common
stock outstanding or issuable in connection with the Merger 330 — 3,251 — — — — 3,251
Shares of common stock issued or issuable in connection with the Merger (Treasury
shares withheld for payment of taxes, $10.92 per share)(1) 52 — 803 — — 16 (171) 632
Shares of common stock issued and compensation expense associated with vesting
equity awards in connection with the Merger (Treasury shares withheld for
payment of taxes, $7.99 per share)(1) 2 — 75 — — 3 (20) 55
Sale of Treasury shares ($10.78 per share)(1) — — 1 — — (18) 191 192
Balance at December 31, 2008 (Successor) 703 $ — $ 13,714 $ (8,608) $ (4,080) 8 $ (152) $ 874
(1) Weighted average price per share
The accompanying notes are an integral part of these Consolidated Financial Statements.
F-6