Delta Airlines 2008 Annual Report Download - page 116
Download and view the complete annual report
Please find page 116 of the 2008 Delta Airlines annual report below. You can navigate through the pages in the report by either clicking on the pages listed below, or by using the keyword search tool below to find specific information within the annual report.-
 1
1 -
2
-
3
-
4
-
5
-
6
-
7
-
8
-
9
-
10
-
11
-
12
-
13
-
14
-
15
-
16
-
17
-
18
-
19
-
20
-
21
-
22
-
23
-
24
-
25
-
26
-
27
-
28
-
29
-
30
-
31
-
32
-
33
-
34
-
35
-
36
-
37
-
38
-
39
-
40
-
41
-
42
-
43
-
44
-
45
-
46
-
47
-
48
-
49
-
50
-
51
-
52
-
53
-
54
-
55
-
56
-
57
-
58
-
59
-
60
-
61
-
62
-
63
-
64
-
65
-
66
-
67
-
68
-
69
-
70
-
71
-
72
-
73
-
74
-
75
-
76
-
77
-
78
-
79
-
80
-
81
-
82
-
83
-
84
-
85
-
86
-
87
-
88
-
89
-
90
-
91
-
92
-
93
-
94
-
95
-
96
-
97
-
98
-
99
-
100
-
101
-
102
-
103
-
104
-
105
-
 106
106 -
 107
107 -
 108
108 -
 109
109 -
 110
110 -
 111
111 -
 112
112 -
 113
113 -
 114
114 -
 115
115 -
 116
116 -
 117
117 -
 118
118 -
 119
119 -
 120
120 -
 121
121 -
 122
122 -
 123
123 -
 124
124 -
 125
125 -
 126
126 -
127
-
128
-
129
-
130
-
131
-
132
-
133
-
134
-
135
-
136
-
137
-
138
-
139
-
140
-
141
-
142
-
143
-
144
-
145
-
146
-
147
-
148
-
149
-
150
-
151
-
152
-
153
-
154
-
155
-
156
-
157
-
158
-
159
-
160
-
161
-
162
-
163
-
164
-
165
-
166
-
167
-
168
-
169
-
170
-
171
-
172
-
173
-
174
-
175
-
176
-
177
-
178
-
179
-
180
-
181
-
182
-
183
-
184
-
185
-
186
-
187
-
188
-
189
-
190
-
191
-
192
-
193
-
194
-
195
-
196
-
197
-
198
-
199
-
200
-
201
-
202
-
203
-
204
-
205
-
206
-
207
-
208
 |
 |

Table of Contents
Index to Financial Statements
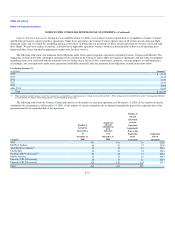
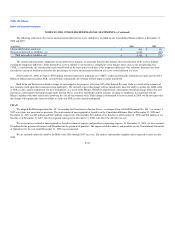
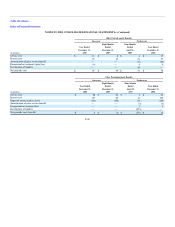
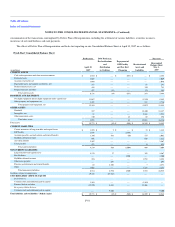
NOTES TO THE CONSOLIDATED FINANCIAL STATEMENTS—(Continued)
Obligations, Fair Value of Plan Assets, and Funded Status (measured at December 31, 2008, December 31, 2007, April 30, 2007) were:
Pension Benefits Other Postretirement Benefits Other Postemployment Benefits
Successor Successor Predecessor Successor Successor Predecessor Successor Successor Predecessor
(in millions)
Year Ended
December 31,
2008
Eight Months
Ended
December 31,
2007
Four Months
Ended
April 30,
2007
Year Ended
December 31,
2008
Eight Months
Ended
December 31,
2007
Four Months
Ended
April 30,
2007
Year Ended
December 31,
2008
Eight Months
Ended
December 31,
2007
Four Months
Ended
April 30,
2007
Benefit obligation at beginning of period $ 7,383 $ 7,627 $ 7,555 $ 965 $ 1,147 $ 1,161 $ 2,028 $ 2,089 $ 2,238
Obligations assumed in Merger 7,469 — — 501 — — 58 — —
Service cost — — — 10 8 4 28 21 8
Interest cost 550 296 145 65 42 21 127 82 41
Actuarial loss (gain) 1,164 (207) 151 (147) (178) 30 (132) (75) (159)
Benefits paid, including lump sums and
annuities (637) (333) (293) (142) (93) (57) (139) (89) (78)
Participant contributions — — — 54 39 15 — — —
Settlement gain on termination — — (40) — — — — — —
Elimination of early measurement date — — 109 — — (27) — — 39
Benefit obligation at end of period $ 15,929 $ 7,383 $ 7,627 $ 1,306 $ 965 $ 1,147 $ 1,970 $ 2,028 $ 2,089
Fair value of plan assets
at beginning of period $ 4,882 $ 4,888 $ 4,590 $ — $ — $ — $ 1,764 $ 1,829 $ 1,781
Assets acquired in Merger 4,015 — — 4 — — — — —
Actual (loss) gain on plan assets (1,090) 260 533 — — — (497) 61 203
Employer contributions 125 67 58 88 54 42 1 — —
Participant contributions — — — 54 39 15 — — —
Benefits paid, including lump sums and
annuities (637) (333) (293) (142) (93) (57) (220) (126) (155)
Fair value of plan assets at end of period $ 7,295 $ 4,882 $ 4,888 $ 4 $ — $ — $ 1,048 $ 1,764 $ 1,829
Funded status at end of period $ 8,634 $ 2,501 $ 2,739 $ 1,302 $ 965 $ 1,147 $ 922 $ 264 $ 260
F-46