Delta Airlines 2008 Annual Report Download - page 84
Download and view the complete annual report
Please find page 84 of the 2008 Delta Airlines annual report below. You can navigate through the pages in the report by either clicking on the pages listed below, or by using the keyword search tool below to find specific information within the annual report.-
 1
1 -
2
-
3
-
4
-
5
-
6
-
7
-
8
-
9
-
10
-
11
-
12
-
13
-
14
-
15
-
16
-
17
-
18
-
19
-
20
-
21
-
22
-
23
-
24
-
25
-
26
-
27
-
28
-
29
-
30
-
31
-
32
-
33
-
34
-
35
-
36
-
37
-
38
-
39
-
40
-
41
-
42
-
43
-
44
-
45
-
46
-
47
-
48
-
49
-
50
-
51
-
52
-
53
-
54
-
55
-
56
-
57
-
58
-
59
-
60
-
61
-
62
-
63
-
64
-
65
-
66
-
67
-
68
-
69
-
70
-
71
-
72
-
73
-
 74
74 -
 75
75 -
 76
76 -
 77
77 -
 78
78 -
 79
79 -
 80
80 -
 81
81 -
 82
82 -
 83
83 -
 84
84 -
 85
85 -
 86
86 -
 87
87 -
 88
88 -
 89
89 -
 90
90 -
 91
91 -
 92
92 -
 93
93 -
 94
94 -
95
-
96
-
97
-
98
-
99
-
100
-
101
-
102
-
103
-
104
-
105
-
106
-
107
-
108
-
109
-
110
-
111
-
112
-
113
-
114
-
115
-
116
-
117
-
118
-
119
-
120
-
121
-
122
-
123
-
124
-
125
-
126
-
127
-
128
-
129
-
130
-
131
-
132
-
133
-
134
-
135
-
136
-
137
-
138
-
139
-
140
-
141
-
142
-
143
-
144
-
145
-
146
-
147
-
148
-
149
-
150
-
151
-
152
-
153
-
154
-
155
-
156
-
157
-
158
-
159
-
160
-
161
-
162
-
163
-
164
-
165
-
166
-
167
-
168
-
169
-
170
-
171
-
172
-
173
-
174
-
175
-
176
-
177
-
178
-
179
-
180
-
181
-
182
-
183
-
184
-
185
-
186
-
187
-
188
-
189
-
190
-
191
-
192
-
193
-
194
-
195
-
196
-
197
-
198
-
199
-
200
-
201
-
202
-
203
-
204
-
205
-
206
-
207
-
208
 |
 |

Table of Contents
Index to Financial Statements
NOTES TO THE CONSOLIDATED FINANCIAL STATEMENTS—(Continued)
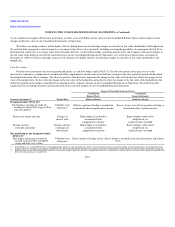
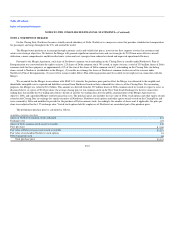
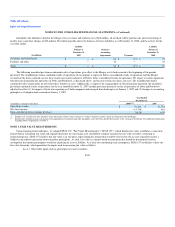
We record property and equipment at cost and depreciate or amortize these assets on a straight-line basis to their estimated residual values over their
respective estimated useful lives. Residual values for owned spare parts and simulators are generally 5% of cost except when guaranteed by a third party for a
different amount. In connection with our adoption of fresh start reporting, we increased our residual values for flight equipment from 5% to 10% of cost.
Additionally, we adjusted the net book values of property and equipment to their estimated fair values and adjusted the estimated useful lives of flight
equipment. The estimated useful lives for major asset classifications are as follows:
Estimated Useful Life
Asset Classification Successor Predecessor
Flight equipment 21-30 years 25 years
Capitalized software(1) 3-7 years 5-7 years
Ground property and equipment 3-40 years 3-40 years
Leasehold improvements
Shorter of lease term or
estimated useful life
Shorter of lease term or
estimated useful life
Flight equipment under capital lease
Shorter of lease term or
estimated useful life
Shorter of lease term or
estimated useful life
(1) We capitalize certain internal and external costs incurred to develop internal-use software. For the year ended December 31, 2008, the eight months ended December 31, 2007, the four
months ended April 30, 2007 and the year ended December 31, 2006, we recorded $99 million, $67 million, $34 million and $109 million, respectively, for amortization of internal-use
software. The net book value of these assets totaled $229 million and $246 million at December 31, 2008 and 2007, respectively.
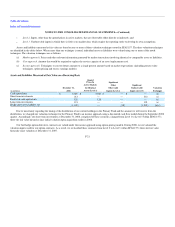
In accordance with SFAS No. 144, "Accounting for the Impairment or Disposal of Long-Lived Assets," we record impairment losses on long-lived
assets used in operations when events and circumstances indicate the assets may be impaired and the estimated future cash flows generated by those assets are
less than their carrying amounts. For long-lived assets held for sale, we record impairment losses when the carrying amount is greater than the fair value less
the cost to sell. We discontinue depreciation of long-lived assets when these assets are classified as held for sale.
To determine impairments for aircraft used in operations, we group assets at the fleet-type level (the lowest level for which there are identifiable cash
flows) and then estimate future cash flows based on projections of capacity, passenger yield, fuel costs, labor costs and other relevant factors. If impairment
occurs, the impairment loss recognized is the amount by which the aircraft's carrying amount exceeds its estimated fair value. We estimate aircraft fair values
using published sources, appraisals and bids received from third parties, as available.
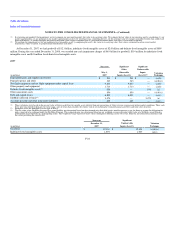
Goodwill and Other Intangible Assets
Goodwill reflects (1) the excess of the reorganization value of the Successor over the fair value of tangible and identifiable intangible assets, net of
liabilities, from the adoption of fresh start reporting, adjusted for impairment, and (2) the excess of purchase price over the fair values of the tangible and
identifiable intangible assets acquired and liabilities assumed from Northwest in the Merger.
Identifiable intangible assets reflect intangible assets (1) recorded as a result of our adoption of fresh start reporting upon emergence from bankruptcy
and (2) acquired in the Merger. Indefinite-lived assets are not amortized. Definite-lived intangible assets are amortized on a straight-line basis or under the
cash flows method over the estimated economic life of the respective agreements and contracts.
In accordance with SFAS No. 142, "Goodwill and Other Intangible Assets" ("SFAS 142"), we apply a fair value-based impairment test to the net book
value of goodwill and indefinite-lived intangible assets on an annual
F-14