Delta Airlines 2008 Annual Report Download - page 95
Download and view the complete annual report
Please find page 95 of the 2008 Delta Airlines annual report below. You can navigate through the pages in the report by either clicking on the pages listed below, or by using the keyword search tool below to find specific information within the annual report.-
 1
1 -
2
-
3
-
4
-
5
-
6
-
7
-
8
-
9
-
10
-
11
-
12
-
13
-
14
-
15
-
16
-
17
-
18
-
19
-
20
-
21
-
22
-
23
-
24
-
25
-
26
-
27
-
28
-
29
-
30
-
31
-
32
-
33
-
34
-
35
-
36
-
37
-
38
-
39
-
40
-
41
-
42
-
43
-
44
-
45
-
46
-
47
-
48
-
49
-
50
-
51
-
52
-
53
-
54
-
55
-
56
-
57
-
58
-
59
-
60
-
61
-
62
-
63
-
64
-
65
-
66
-
67
-
68
-
69
-
70
-
71
-
72
-
73
-
74
-
75
-
76
-
77
-
78
-
79
-
80
-
81
-
82
-
83
-
84
-
 85
85 -
 86
86 -
 87
87 -
 88
88 -
 89
89 -
 90
90 -
 91
91 -
 92
92 -
 93
93 -
 94
94 -
 95
95 -
 96
96 -
 97
97 -
 98
98 -
 99
99 -
 100
100 -
 101
101 -
 102
102 -
 103
103 -
 104
104 -
 105
105 -
106
-
107
-
108
-
109
-
110
-
111
-
112
-
113
-
114
-
115
-
116
-
117
-
118
-
119
-
120
-
121
-
122
-
123
-
124
-
125
-
126
-
127
-
128
-
129
-
130
-
131
-
132
-
133
-
134
-
135
-
136
-
137
-
138
-
139
-
140
-
141
-
142
-
143
-
144
-
145
-
146
-
147
-
148
-
149
-
150
-
151
-
152
-
153
-
154
-
155
-
156
-
157
-
158
-
159
-
160
-
161
-
162
-
163
-
164
-
165
-
166
-
167
-
168
-
169
-
170
-
171
-
172
-
173
-
174
-
175
-
176
-
177
-
178
-
179
-
180
-
181
-
182
-
183
-
184
-
185
-
186
-
187
-
188
-
189
-
190
-
191
-
192
-
193
-
194
-
195
-
196
-
197
-
198
-
199
-
200
-
201
-
202
-
203
-
204
-
205
-
206
-
207
-
208
 |
 |
Table of Contents
Index to Financial Statements
NOTES TO THE CONSOLIDATED FINANCIAL STATEMENTS—(Continued)
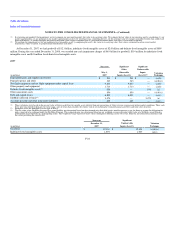
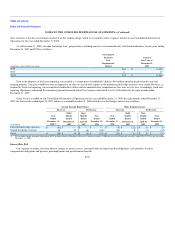
NOTE 4. RISK MANAGEMENT AND FINANCIAL INSTRUMENTS
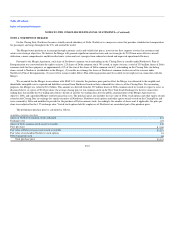
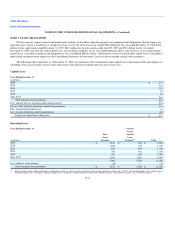
The following table reflects the estimated fair value position of our hedge derivatives at December 31, 2008:
Estimated Fair Value Gain (Loss)
(in millions) Assets
Accounts
Payable
Hedge
Derivatives
Liability
Other
Noncurrent
Liabilities
Hedge
Margin
Receivable(4)
Fuel hedge swaps, collars and call options
Hedges designated under SFAS 133(1) $ 26 $ (66) $ (849) $ —
Undesignated hedges(2) — (119) (318) —
Total fuel hedge swaps, collars and call options 26 (185) (1,167) —
Interest rate swaps designated as fair value hedges(3) 91 — — —
Interest rate swaps and caps designated as cash flow hedges(2) — — (32) (63)
Foreign currency exchange forwards and collars(2) — — (48) —
Total fuel hedge swaps, collars and call options $ 117 $ (185) $ (1,247) $ (63) $ 1,139
(1) Includes $163 million in hedges assumed from Northwest in the Merger.
(2) Represents derivative contracts assumed from Northwest in the Merger.
(3) Includes $17 million in accrued interest receivable related to these interest rate swaps.
(4) Represents the net margin postings associated with the open position of our hedge derivative contracts.
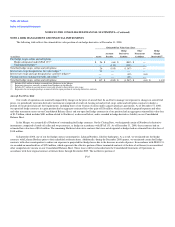
Aircraft Fuel Price Risk
Our results of operations are materially impacted by changes in the price of aircraft fuel. In an effort to manage our exposure to changes in aircraft fuel
prices, we periodically enter into derivative instruments comprised of crude oil, heating oil and jet fuel swap, collar and call option contracts to hedge a
portion of our projected aircraft fuel requirements, including those of our Contract Carriers under capacity purchase agreements. As of December 31, 2008,
our open fuel hedge contracts in a gain position had an aggregate estimated fair value gain of $26 million, which is recorded in prepaid expenses and other
and other noncurrent assets on our Consolidated Balance Sheet, and our open fuel hedge contracts in a loss position had an aggregate estimated fair value loss
of $1.2 billion, which includes $481 million related to Northwest, as discussed below, and is recorded in hedge derivatives liability on our Consolidated
Balance Sheet.
In the Merger, we assumed all of Northwest's outstanding fuel hedge contracts. On the Closing Date, we designated certain of Northwest's derivative
instruments, comprised of crude oil collar and swap contracts, as hedges in accordance with SFAS 133. As of December 31, 2008, these contracts had an
estimated fair value loss of $163 million. The remaining Northwest derivative contracts that were not designated as hedges had an estimated fair value loss of
$318 million.
In September 2008, one of our fuel hedge contract counterparties, Lehman Brothers, filed for bankruptcy. As a result, we terminated our fuel hedge
contracts with Lehman Brothers prior to their scheduled settlement dates. Additionally, during the December 2008 quarter, we terminated certain fuel hedge
contracts with other counterparties to reduce our exposure to projected fuel hedge losses due to the decrease in crude oil prices. In accordance with SFAS 133,
we recorded an unrealized loss of $324 million, which represents the effective portion of these terminated contracts at the date of settlement, in accumulated
other comprehensive income on our Consolidated Balance Sheet. These losses will be reclassified into the Consolidated Statements of Operations in
accordance with their original contract settlement dates through December 2009. The ineffective portion of
F-25