Delta Airlines 2008 Annual Report Download - page 90
Download and view the complete annual report
Please find page 90 of the 2008 Delta Airlines annual report below. You can navigate through the pages in the report by either clicking on the pages listed below, or by using the keyword search tool below to find specific information within the annual report.-
 1
1 -
2
-
3
-
4
-
5
-
6
-
7
-
8
-
9
-
10
-
11
-
12
-
13
-
14
-
15
-
16
-
17
-
18
-
19
-
20
-
21
-
22
-
23
-
24
-
25
-
26
-
27
-
28
-
29
-
30
-
31
-
32
-
33
-
34
-
35
-
36
-
37
-
38
-
39
-
40
-
41
-
42
-
43
-
44
-
45
-
46
-
47
-
48
-
49
-
50
-
51
-
52
-
53
-
54
-
55
-
56
-
57
-
58
-
59
-
60
-
61
-
62
-
63
-
64
-
65
-
66
-
67
-
68
-
69
-
70
-
71
-
72
-
73
-
74
-
75
-
76
-
77
-
78
-
79
-
 80
80 -
 81
81 -
 82
82 -
 83
83 -
 84
84 -
 85
85 -
 86
86 -
 87
87 -
 88
88 -
 89
89 -
 90
90 -
 91
91 -
 92
92 -
 93
93 -
 94
94 -
 95
95 -
 96
96 -
 97
97 -
 98
98 -
 99
99 -
 100
100 -
101
-
102
-
103
-
104
-
105
-
106
-
107
-
108
-
109
-
110
-
111
-
112
-
113
-
114
-
115
-
116
-
117
-
118
-
119
-
120
-
121
-
122
-
123
-
124
-
125
-
126
-
127
-
128
-
129
-
130
-
131
-
132
-
133
-
134
-
135
-
136
-
137
-
138
-
139
-
140
-
141
-
142
-
143
-
144
-
145
-
146
-
147
-
148
-
149
-
150
-
151
-
152
-
153
-
154
-
155
-
156
-
157
-
158
-
159
-
160
-
161
-
162
-
163
-
164
-
165
-
166
-
167
-
168
-
169
-
170
-
171
-
172
-
173
-
174
-
175
-
176
-
177
-
178
-
179
-
180
-
181
-
182
-
183
-
184
-
185
-
186
-
187
-
188
-
189
-
190
-
191
-
192
-
193
-
194
-
195
-
196
-
197
-
198
-
199
-
200
-
201
-
202
-
203
-
204
-
205
-
206
-
207
-
208
 |
 |
Table of Contents
Index to Financial Statements
NOTES TO THE CONSOLIDATED FINANCIAL STATEMENTS—(Continued)
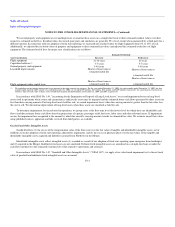
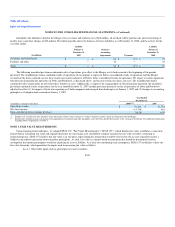
Included in the liabilities valued in the Merger were severance and related costs of $62 million, all of which will be paid in cash, and restructuring of
facility leases and other charges of $32 million. The following table shows the balances for these liabilities as of December 31, 2008, and the activity for the
year then ended:
(in millions)
Liability
Balance at
December 31,
2007
Purchase
Accounting
Adjustments
Payments
Liability
Balance at
December 31,
2008
Severence and related costs $ — $ 62 $ (15) $ 47
Facilities and other
—
32
—
32
Total $ — $ 94 $ (15) $ 79
The following unaudited pro forma combined results of operations give effect to the Merger as if it had occurred at the beginning of the periods
presented. The unaudited pro forma combined results of operations do not purport to represent Delta's consolidated results of operations had the Merger
occurred on the dates assumed, nor are these results necessarily indicative of Delta's future consolidated results of operations. We expect to realize significant
benefits from integrating the operations of Delta and Northwest, as discussed above, and to incur certain one-time cash costs. The unaudited pro forma
combined results of operations do not reflect these benefits or costs. Additionally, to improve the comparability of the information presented, the unaudited
pro forma combined results of operations for the year ended December 31, 2007 include pro forma historical results of operations of Delta and Northwest
adjusted to reflect (1) the impact of fresh start reporting as if both companies had emerged from bankruptcy on January 1, 2007 and (2) changes in accounting
principles as if adoption had occurred on January 1, 2007.
Year Ended
December 31,
(in millions, except per share data) 2008(1)(2) 2007
Operating revenue $ 34,244 $ 31,781
Net (loss) income (14,738) 601
Basic and diluted (loss) earnings per share (18.18) 0.74
(1) Includes a $1.1 billion one-time primarily non-cash charge relating to the issuance or vesting of employee equity awards in connection with the Merger.
(2) Includes $11.6 billion in non-cash charges from impairments of goodwill and other intangible assets for Delta and Northwest prior to the closing of the Merger. For additional information
regarding Delta's impairment, see Note 5.
NOTE 3. FAIR VALUE MEASUREMENTS
Upon emerging from bankruptcy, we adopted SFAS 157, "Fair Value Measurements" ("SFAS 157"), which defines fair value, establishes a consistent
framework for measuring fair value and expands disclosure for each major asset and liability category measured at fair value on either a recurring or
nonrecurring basis. SFAS 157 clarifies that fair value is an exit price, representing the amount that would be received to sell an asset or paid to transfer a
liability in an orderly transaction between market participants. As such, fair value is a market-based measurement that should be determined based on
assumptions that market participants would use in pricing an asset or liability. As a basis for considering such assumptions, SFAS 157 establishes a three-tier
fair value hierarchy, which prioritizes the inputs used in measuring fair value as follows:
• Level 1. Observable inputs such as quoted prices in active markets;
F-20