Delta Airlines 2008 Annual Report Download - page 83
Download and view the complete annual report
Please find page 83 of the 2008 Delta Airlines annual report below. You can navigate through the pages in the report by either clicking on the pages listed below, or by using the keyword search tool below to find specific information within the annual report.-
 1
1 -
2
-
3
-
4
-
5
-
6
-
7
-
8
-
9
-
10
-
11
-
12
-
13
-
14
-
15
-
16
-
17
-
18
-
19
-
20
-
21
-
22
-
23
-
24
-
25
-
26
-
27
-
28
-
29
-
30
-
31
-
32
-
33
-
34
-
35
-
36
-
37
-
38
-
39
-
40
-
41
-
42
-
43
-
44
-
45
-
46
-
47
-
48
-
49
-
50
-
51
-
52
-
53
-
54
-
55
-
56
-
57
-
58
-
59
-
60
-
61
-
62
-
63
-
64
-
65
-
66
-
67
-
68
-
69
-
70
-
71
-
72
-
 73
73 -
 74
74 -
 75
75 -
 76
76 -
 77
77 -
 78
78 -
 79
79 -
 80
80 -
 81
81 -
 82
82 -
 83
83 -
 84
84 -
 85
85 -
 86
86 -
 87
87 -
 88
88 -
 89
89 -
 90
90 -
 91
91 -
 92
92 -
 93
93 -
94
-
95
-
96
-
97
-
98
-
99
-
100
-
101
-
102
-
103
-
104
-
105
-
106
-
107
-
108
-
109
-
110
-
111
-
112
-
113
-
114
-
115
-
116
-
117
-
118
-
119
-
120
-
121
-
122
-
123
-
124
-
125
-
126
-
127
-
128
-
129
-
130
-
131
-
132
-
133
-
134
-
135
-
136
-
137
-
138
-
139
-
140
-
141
-
142
-
143
-
144
-
145
-
146
-
147
-
148
-
149
-
150
-
151
-
152
-
153
-
154
-
155
-
156
-
157
-
158
-
159
-
160
-
161
-
162
-
163
-
164
-
165
-
166
-
167
-
168
-
169
-
170
-
171
-
172
-
173
-
174
-
175
-
176
-
177
-
178
-
179
-
180
-
181
-
182
-
183
-
184
-
185
-
186
-
187
-
188
-
189
-
190
-
191
-
192
-
193
-
194
-
195
-
196
-
197
-
198
-
199
-
200
-
201
-
202
-
203
-
204
-
205
-
206
-
207
-
208
 |
 |
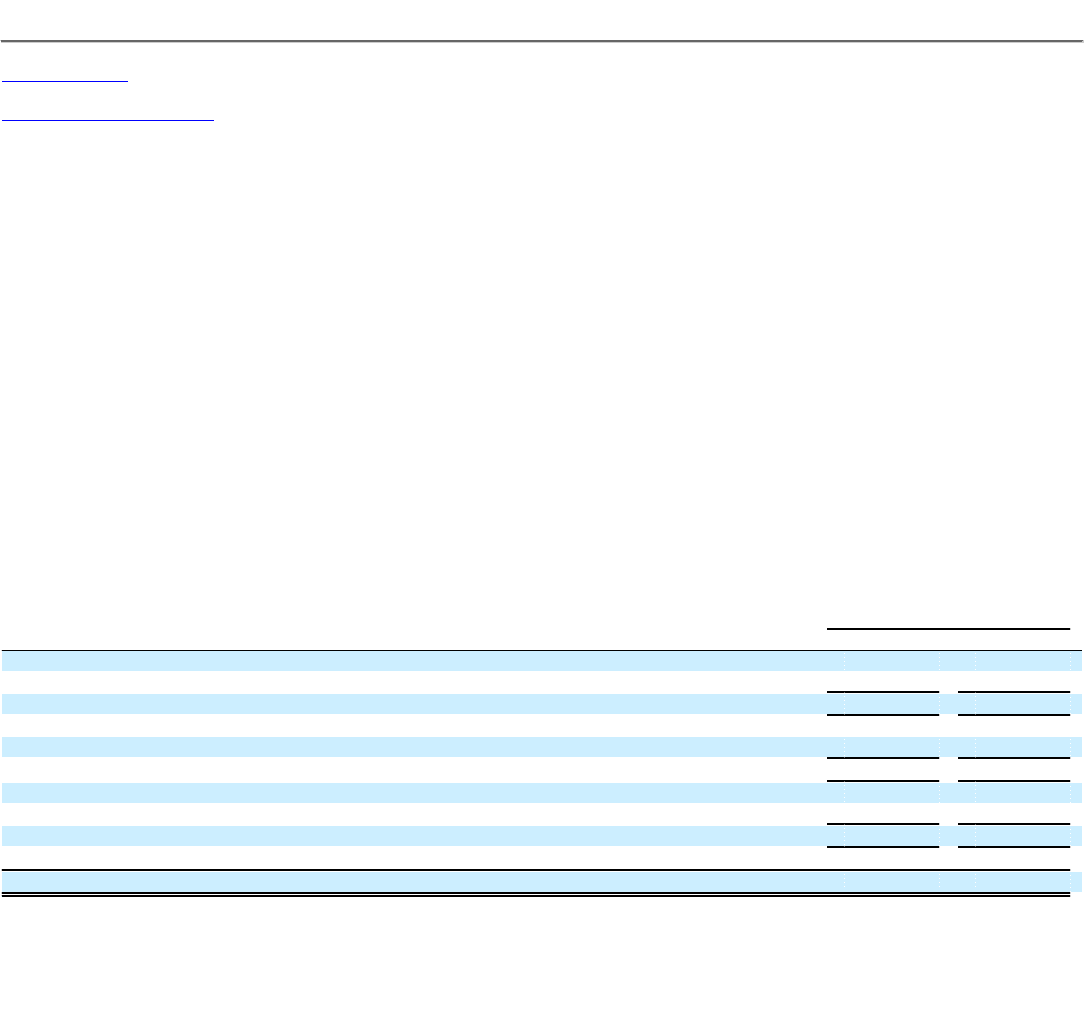
Table of Contents
Index to Financial Statements
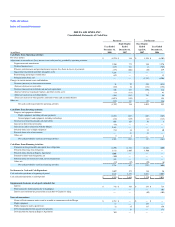
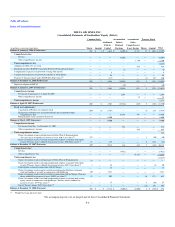
NOTES TO THE CONSOLIDATED FINANCIAL STATEMENTS—(Continued)
Regional Carriers Revenue. During the year ended December 31, 2008, we had contract carrier agreements with 12 Contract Carriers, including our
wholly-owned subsidiaries, Comair, Inc. ("Comair"), Compass Airlines, Inc. ("Compass") and Mesaba Aviation, Inc. ("Mesaba"). Compass and Mesaba
began operating as Contract Carriers on the Closing Date. Our Contract Carrier agreements are structured as either (1) capacity purchase agreements whereby
we purchase all or a portion of the Contract Carrier's capacity and are responsible for selling the seat inventory we purchase or (2) revenue proration
agreements, which are based on a fixed dollar or percentage division of revenues for tickets sold to passengers traveling on connecting flight itineraries. We
record revenue related to all of our Contract Carrier agreements as regional carriers passenger revenue. We record expenses related to our Contract Carrier
agreements, excluding Comair, Compass and Mesaba, as contract carrier arrangements expense.
Cargo Revenue
Cargo revenue is recognized in our Consolidated Statements of Operations when we provide the transportation.
Other, net Revenue
Other, net revenue includes revenue from (1) the Marketing Premium component of the sale of mileage credits in the SkyMiles and WorldPerks
Programs discussed above, (2) our sale of seats on other airlines' flights under codeshare agreements and (3) other miscellaneous service revenue. Our revenue
from other airlines' sale of seats on our flights under codeshare agreements is recorded in passenger revenue on our Consolidated Statements of Operations.
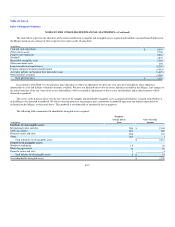
Long-Lived Assets
The following table shows our property and equipment at December 31, 2008 and 2007:
December 31,
(in millions) 2008 2007
Flight equipment $ 18,237 $ 9,525
Accumulated depreciation (828) (299)
Flight equipment, net 17,409 9,226
Ground property and equipment 2,715 1,943
Accumulated depreciation (578) (246)
Ground property and equipment, net 2,137 1,697
Flight and ground equipment under capital leases 708 602
Accumulated amortization (152) (63)
Flight and ground equipment under capital leases, net 556 539
Advance payments for equipment 525 239
Total property and equipment, net $ 20,627 $ 11,701
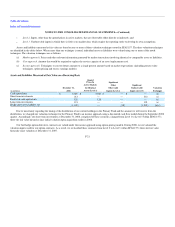
During the year ended December 31, 2008, we sold 20 aircraft, including seven CRJ-100 aircraft, five B-757-200 aircraft, four A320-200 aircraft, and
four DC-9-30 aircraft. In addition, we sold two B-747-200F airframes and one EMB-120 airframe. Proceeds from these sales totaled $123 million and resulted
in a gain of $21 million.
F-13