Delta Airlines 2008 Annual Report Download - page 59
Download and view the complete annual report
Please find page 59 of the 2008 Delta Airlines annual report below. You can navigate through the pages in the report by either clicking on the pages listed below, or by using the keyword search tool below to find specific information within the annual report.-
 1
1 -
2
-
3
-
4
-
5
-
6
-
7
-
8
-
9
-
10
-
11
-
12
-
13
-
14
-
15
-
16
-
17
-
18
-
19
-
20
-
21
-
22
-
23
-
24
-
25
-
26
-
27
-
28
-
29
-
30
-
31
-
32
-
33
-
34
-
35
-
36
-
37
-
38
-
39
-
40
-
41
-
42
-
43
-
44
-
45
-
46
-
47
-
48
-
 49
49 -
 50
50 -
 51
51 -
 52
52 -
 53
53 -
 54
54 -
 55
55 -
 56
56 -
 57
57 -
 58
58 -
 59
59 -
 60
60 -
 61
61 -
 62
62 -
 63
63 -
 64
64 -
 65
65 -
 66
66 -
 67
67 -
 68
68 -
 69
69 -
70
-
71
-
72
-
73
-
74
-
75
-
76
-
77
-
78
-
79
-
80
-
81
-
82
-
83
-
84
-
85
-
86
-
87
-
88
-
89
-
90
-
91
-
92
-
93
-
94
-
95
-
96
-
97
-
98
-
99
-
100
-
101
-
102
-
103
-
104
-
105
-
106
-
107
-
108
-
109
-
110
-
111
-
112
-
113
-
114
-
115
-
116
-
117
-
118
-
119
-
120
-
121
-
122
-
123
-
124
-
125
-
126
-
127
-
128
-
129
-
130
-
131
-
132
-
133
-
134
-
135
-
136
-
137
-
138
-
139
-
140
-
141
-
142
-
143
-
144
-
145
-
146
-
147
-
148
-
149
-
150
-
151
-
152
-
153
-
154
-
155
-
156
-
157
-
158
-
159
-
160
-
161
-
162
-
163
-
164
-
165
-
166
-
167
-
168
-
169
-
170
-
171
-
172
-
173
-
174
-
175
-
176
-
177
-
178
-
179
-
180
-
181
-
182
-
183
-
184
-
185
-
186
-
187
-
188
-
189
-
190
-
191
-
192
-
193
-
194
-
195
-
196
-
197
-
198
-
199
-
200
-
201
-
202
-
203
-
204
-
205
-
206
-
207
-
208
 |
 |

Table of Contents
Index to Financial Statements
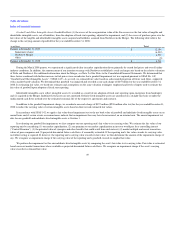
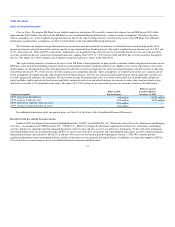
As of January 31, 2009, our open fuel hedging position, excluding contracts we terminated early for the years ending December 31, 2009 and 2010 is as
follows:
(in millions, unless otherwise stated)
Weighted
Average Contract
Strike Price per
Gallon
Percentage of
Projected
Fuel
Requirements
Hedged
Contract Fair
Value at
January 31, 2009
Based Upon $42
per Barrel of
Crude Oil
2009
Heating oil
Call options $ 1.90 3% $ 14
Collars —cap/floor 3.05/2.81 6 (282)
Swaps 1.56 5 (15)
Collars not designated under SFAS 133 4.15/3.42/4.88 1 (28)
Crude Oil
Call options 1.86 14 33
Collars—cap/floor 2.84/2.46 8 (376)
Swaps 1.58 4 (47)
Collars not designated under SFAS 133 3.15/2.73/3.80 2 (142)
Jet Fuel
Collars—cap/floor 3.48/3.31 1 (39)
Swaps 1.63 17 (54)
Swaps not designated under SFAS 133 3.83/4.75 1 (75)
Total 62% $ (1,011)
2010
Crude oil
Call options $ 1.71 9% $ 55
Total 9% $ 55
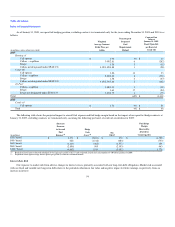
The following table shows the projected impact to aircraft fuel expense and fuel hedge margin based on the impact of our open fuel hedge contracts at
January 31, 2009, excluding contracts we terminated early, assuming the following per barrel of crude oil sensitivities for 2009:
(in millions)
(Increase)
Decrease
to Aircraft
Fuel
Expense(1)
Hedge
Gain
(Loss)(2) Net
impact
Fuel Hedge
Margin
Received by
(Posted to)
Counterparties
$20 / barrel $ 2,371 $ (2,101) $ 270 $ (1,758)
$40 / barrel 628 (1,312) (684) (753)
$60 / barrel (1,115) (462) (1,577) 108
$80 / barrel (2,858) 505 (2,353) 943
$100 / barrel (4,602) 1,519 (3,083) 1,776
(1) Projection based upon estimated unhedged jet fuel price per gallon of $1.83 and estimated aircraft fuel consumption of 4.0 billion gallons for 2009.
(2) Projection based upon average futures prices per gallon by contract settlement month.
Interest Rate Risk
Our exposure to market risk from adverse changes in interest rates is primarily associated with our long-term debt obligations. Market risk associated
with our fixed and variable rate long-term debt relates to the potential reduction in fair value and negative impact to future earnings, respectively, from an
increase in interest
54