Delta Airlines 2008 Annual Report Download - page 44
Download and view the complete annual report
Please find page 44 of the 2008 Delta Airlines annual report below. You can navigate through the pages in the report by either clicking on the pages listed below, or by using the keyword search tool below to find specific information within the annual report.-
 1
1 -
2
-
3
-
4
-
5
-
6
-
7
-
8
-
9
-
10
-
11
-
12
-
13
-
14
-
15
-
16
-
17
-
18
-
19
-
20
-
21
-
22
-
23
-
24
-
25
-
26
-
27
-
28
-
29
-
30
-
31
-
32
-
33
-
 34
34 -
 35
35 -
 36
36 -
 37
37 -
 38
38 -
 39
39 -
 40
40 -
 41
41 -
 42
42 -
 43
43 -
 44
44 -
 45
45 -
 46
46 -
 47
47 -
 48
48 -
 49
49 -
 50
50 -
 51
51 -
 52
52 -
 53
53 -
 54
54 -
55
-
56
-
57
-
58
-
59
-
60
-
61
-
62
-
63
-
64
-
65
-
66
-
67
-
68
-
69
-
70
-
71
-
72
-
73
-
74
-
75
-
76
-
77
-
78
-
79
-
80
-
81
-
82
-
83
-
84
-
85
-
86
-
87
-
88
-
89
-
90
-
91
-
92
-
93
-
94
-
95
-
96
-
97
-
98
-
99
-
100
-
101
-
102
-
103
-
104
-
105
-
106
-
107
-
108
-
109
-
110
-
111
-
112
-
113
-
114
-
115
-
116
-
117
-
118
-
119
-
120
-
121
-
122
-
123
-
124
-
125
-
126
-
127
-
128
-
129
-
130
-
131
-
132
-
133
-
134
-
135
-
136
-
137
-
138
-
139
-
140
-
141
-
142
-
143
-
144
-
145
-
146
-
147
-
148
-
149
-
150
-
151
-
152
-
153
-
154
-
155
-
156
-
157
-
158
-
159
-
160
-
161
-
162
-
163
-
164
-
165
-
166
-
167
-
168
-
169
-
170
-
171
-
172
-
173
-
174
-
175
-
176
-
177
-
178
-
179
-
180
-
181
-
182
-
183
-
184
-
185
-
186
-
187
-
188
-
189
-
190
-
191
-
192
-
193
-
194
-
195
-
196
-
197
-
198
-
199
-
200
-
201
-
202
-
203
-
204
-
205
-
206
-
207
-
208
 |
 |

Table of Contents
Index to Financial Statements
considered qualitative and quantitative factors, including our substantial net loss in that year, the non-cash nature of the Accounting Adjustments, our
substantial stockholders' deficit at December 31, 2006, and our status as a debtor-in-possession under Chapter 11 of the Bankruptcy Code during that year.
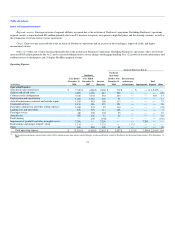
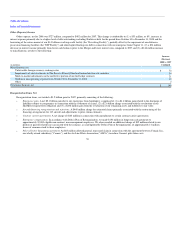
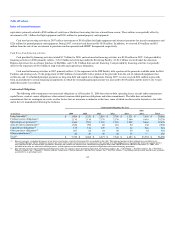
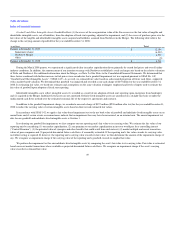
Operating Revenue
Combined Predecessor
Increase
(Decrease)
%
Increase
(Decrease) (in millions)
Year Ended
December 31,
2007
Year Ended
December 31,
2006
Operating Revenue:
Passenger:
Mainline $ 12,758 $ 11,640 $ 1,118 10 %
Regional affiliates 4,170 3,853 317 8 %
Total passenger revenue 16,928 15,493 1,435 9 %
Cargo 482 498 (16) (3)%
Other, net 1,744 1,541 203 13 %
Total operating revenue $ 19,154 $ 17,532 $ 1,622 9 %
Operating revenue totaled $19.2 billion for 2007, a $1.6 billion, or 9%, increase compared to 2006. Passenger revenue increased 9% on a 3% increase in
ASMs, or capacity, and a 1.9 point increase in load factor. The increase in passenger revenue reflects a rise of 4% and 7% in passenger mile yield and
PRASM, respectively. Mainline passenger revenue increased primarily due to (1) strong passenger demand, (2) our increased service to international
destinations, (3) increased SkyMiles revenue associated with Fresh Start Adjustments discussed above and (4) the negative impact of Accounting Adjustments
recorded in 2006 as discussed above. Passenger revenue of regional affiliates increased primarily due to increased flying by our contract carriers, which
resulted in an 8% increase in revenue passenger miles ("RPMs"), or traffic, on 7% greater capacity. Other, net revenue increased primarily due to
(1) increased SkyMiles revenue due to a change in accounting methodology and Fresh Start Adjustments discussed above, (2) increased administrative service
charges and baggage handling fees, (3) growth in aircraft maintenance and staffing services to third parties and (4) the negative impact of Accounting
Adjustments recorded in 2006 as discussed above.
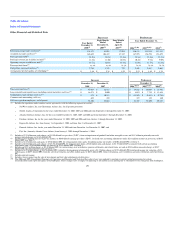
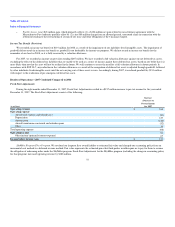
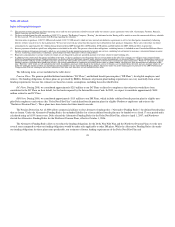
Combined
Increase (Decrease)
Year Ended December 31, 2007 Combined vs. 2006
(in millions)
Year Ended
December 31,
2007
Passenger
Revenue RPMs ASMs
Passenger
Mile
Yield PRASM
Load
Factor
Passenger Revenue:
North America $ 12,062 3% — % (3)% 3 % 7 % 2.5pts
International 4,745 28% 17% 16 % 9 % 11 % 1.0pts
Charter 121 1% 21% 12 % (17)% (9)% 3.2pts
Total passenger revenue $ 16,928 9% 5% 3 % 4 % 7 % 1.9 pts
North American Passenger Revenue. North American passenger revenue increased 3%, driven by a 2.5 point increase in load factor and a 7% increase
in PRASM on a 3% decline in capacity. The passenger mile yield increased 3%. The increases in passenger revenue and PRASM reflect (1) strong passenger
demand and (2) revenue and network productivity improvements, including right-sizing capacity to better meet customer demand and the continued
restructuring of our route network to reduce less productive short haul domestic flights and reallocate widebody aircraft to international routes. As a result of
our efforts to right-size capacity in domestic markets, we increased flying by our contract carriers.
39