Delta Airlines 2008 Annual Report Download - page 11
Download and view the complete annual report
Please find page 11 of the 2008 Delta Airlines annual report below. You can navigate through the pages in the report by either clicking on the pages listed below, or by using the keyword search tool below to find specific information within the annual report.-
 1
1 -
 2
2 -
 3
3 -
 4
4 -
 5
5 -
 6
6 -
 7
7 -
 8
8 -
 9
9 -
 10
10 -
 11
11 -
 12
12 -
 13
13 -
 14
14 -
 15
15 -
 16
16 -
 17
17 -
 18
18 -
 19
19 -
 20
20 -
 21
21 -
 22
22 -
23
-
24
-
25
-
26
-
27
-
28
-
29
-
30
-
31
-
32
-
33
-
34
-
35
-
36
-
37
-
38
-
39
-
40
-
41
-
42
-
43
-
44
-
45
-
46
-
47
-
48
-
49
-
50
-
51
-
52
-
53
-
54
-
55
-
56
-
57
-
58
-
59
-
60
-
61
-
62
-
63
-
64
-
65
-
66
-
67
-
68
-
69
-
70
-
71
-
72
-
73
-
74
-
75
-
76
-
77
-
78
-
79
-
80
-
81
-
82
-
83
-
84
-
85
-
86
-
87
-
88
-
89
-
90
-
91
-
92
-
93
-
94
-
95
-
96
-
97
-
98
-
99
-
100
-
101
-
102
-
103
-
104
-
105
-
106
-
107
-
108
-
109
-
110
-
111
-
112
-
113
-
114
-
115
-
116
-
117
-
118
-
119
-
120
-
121
-
122
-
123
-
124
-
125
-
126
-
127
-
128
-
129
-
130
-
131
-
132
-
133
-
134
-
135
-
136
-
137
-
138
-
139
-
140
-
141
-
142
-
143
-
144
-
145
-
146
-
147
-
148
-
149
-
150
-
151
-
152
-
153
-
154
-
155
-
156
-
157
-
158
-
159
-
160
-
161
-
162
-
163
-
164
-
165
-
166
-
167
-
168
-
169
-
170
-
171
-
172
-
173
-
174
-
175
-
176
-
177
-
178
-
179
-
180
-
181
-
182
-
183
-
184
-
185
-
186
-
187
-
188
-
189
-
190
-
191
-
192
-
193
-
194
-
195
-
196
-
197
-
198
-
199
-
200
-
201
-
202
-
203
-
204
-
205
-
206
-
207
-
208
 |
 |

Table of Contents
Index to Financial Statements
Cargo
Delta Cargo is the largest cargo carrier among the U.S. passenger airlines, based on revenue. Through the strength of our global network, we are able to
connect all of the world's major freight gateways. We generate cargo revenues in domestic and international markets primarily through the use of cargo space
on regularly scheduled passenger aircraft. Additionally, we have a limited, focused network of freighters that tie together the key freight markets in Asia and
connect to three gateways in the U.S.
Delta Cargo is a member of SkyTeam Cargo, the world's largest global airline cargo alliance. The alliance, whose other members are Aeromexico
Cargo, Air France Cargo, Alitalia Cargo, CSA Czech Airlines Cargo, KLM Cargo and Korean Air Cargo, offers a global network with over 16,000 daily
flights spanning 6 continents. This alliance offers cargo customers a consistent international product line, and the partners work to jointly improve their
efficiency and effectiveness in the marketplace.
MRO
Our maintenance, repair and overhaul ("MRO") operations known as Delta TechOps is the largest airline MRO in North America with state-of-the-art
facilities worldwide. In addition to providing maintenance and engineering support for the combined Delta and NWA fleets of nearly 800 aircraft, Delta
TechOps serves more than 125 aviation and airline customers from around the world. Delta TechOps employs approximately 8,500 maintenance professionals
and is one of the most experienced MRO providers in the world.
Among the key services we offer are:
• Airframe Maintenance—aircraft overhaul for both widebody and narrowbody craft;
• Component Maintenance—repair, overhaul, and test facilities for electromechanical components and avionics;
• Engine Maintenance—full overhaul, repair, and support capabilities for engine parts and components;
• Line Maintenance—a full range of ground services including deicing and aircraft parking;
• Support Services—logistics, fleet engineering, engine leasing, and more; and
• Technical Operations Training—technical training for a wide variety of aircraft types.
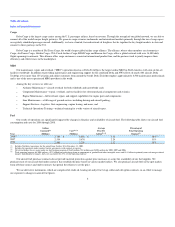
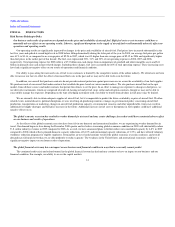
Fuel
Our results of operations are significantly impacted by changes in the price and availability of aircraft fuel. The following table shows our aircraft fuel
consumption and costs for 2006 through 2008.
Year
Gallons
Consumed(2)
(Millions)
Cost(2) (3)
(Millions)
Average
Price Per
Gallon(2) (3)
Percentage of
Total Operating
Expense(2)
2008(1) 2,740 $ 8,686 $ 3.16 38%(4)
2007 2,534 5,676 2.24 31%
2006 2,480 5,250 2.12 30%
(1) Includes Northwest operations for the period from October 30 to December 31, 2008.
(2) Includes the operations under contract carrier agreements with regional air carriers.
(3) Net of fuel hedge (losses) gains under our fuel hedging program of ($65) million, $51 million and ($108) million for 2008, 2007 and 2006,
(4) Total operating expense for 2008 reflects a $7.3 billion non-cash charge from an impairment of goodwill and other intangible assets and $1.1 billion in primarily non-cash merger-related
charges. Including these charges, fuel costs accounted for 28% of total operating expense.
Our aircraft fuel purchase contracts do not provide material protection against price increases or assure the availability of our fuel supplies. We
purchase most of our aircraft fuel under contracts that establish the price based on various market indices. We also purchase aircraft fuel on the spot market,
from off-shore sources and under contracts that permit the refiners to set the price.
We use derivative instruments, which are comprised of crude oil, heating oil and jet fuel swap, collar and call option contracts, in an effort to manage
our exposure to changes in aircraft fuel prices.
6