Burger King 2009 Annual Report Download - page 94
Download and view the complete annual report
Please find page 94 of the 2009 Burger King annual report below. You can navigate through the pages in the report by either clicking on the pages listed below, or by using the keyword search tool below to find specific information within the annual report.-
 1
1 -
2
-
3
-
4
-
5
-
6
-
7
-
8
-
9
-
10
-
11
-
12
-
13
-
14
-
15
-
16
-
17
-
18
-
19
-
20
-
21
-
22
-
23
-
24
-
25
-
26
-
27
-
28
-
29
-
30
-
31
-
32
-
33
-
34
-
35
-
36
-
37
-
38
-
39
-
40
-
41
-
42
-
43
-
44
-
45
-
46
-
47
-
48
-
49
-
50
-
51
-
52
-
53
-
54
-
55
-
56
-
57
-
58
-
59
-
60
-
61
-
62
-
63
-
64
-
65
-
66
-
67
-
68
-
69
-
70
-
71
-
72
-
73
-
74
-
75
-
76
-
77
-
78
-
79
-
80
-
81
-
82
-
83
-
 84
84 -
 85
85 -
 86
86 -
 87
87 -
 88
88 -
 89
89 -
 90
90 -
 91
91 -
 92
92 -
 93
93 -
 94
94 -
 95
95 -
 96
96 -
 97
97 -
 98
98 -
 99
99 -
 100
100 -
 101
101 -
 102
102 -
 103
103 -
 104
104 -
105
-
106
-
107
-
108
-
109
-
110
-
111
-
112
-
113
-
114
-
115
-
116
-
117
-
118
-
119
-
120
-
121
-
122
-
123
-
124
-
125
-
126
-
127
-
128
-
129
-
130
-
131
-
132
-
133
-
134
-
135
-
136
-
137
-
138
-
139
-
140
-
141
-
142
-
143
-
144
-
145
-
146
-
147
-
148
-
149
-
150
-
151
-
152
-
153
-
154
-
155
-
156
-
157
-
158
-
159
-
160
-
161
-
162
-
163
-
164
-
165
-
166
-
167
-
168
-
169
-
170
-
171
-
172
-
173
-
174
-
175
-
176
-
177
-
178
-
179
-
180
-
181
-
182
-
183
-
184
-
185
-
186
-
187
-
188
-
189
-
190
-
191
-
192
-
193
-
194
-
195
-
196
-
197
-
198
-
199
-
200
-
201
-
202
-
203
-
204
-
205
-
206
-
207
-
208
-
209
-
210
-
211
-
212
-
213
-
214
-
215
-
216
-
217
-
218
-
219
-
220
-
221
-
222
-
223
-
224
-
225
 |
 |

Table of Contents
BURGER KING HOLDINGS, INC. AND SUBSIDIARIES
Notes to Consolidated Financial Statements — (Continued)
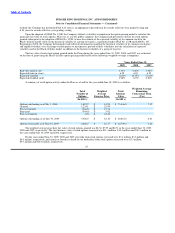
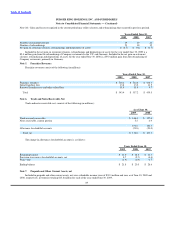
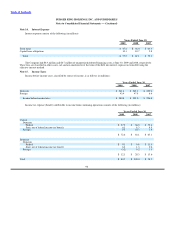
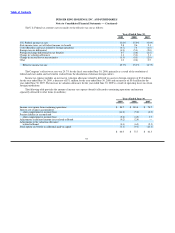
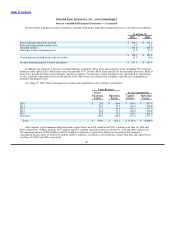
The table below presents intangible assets subject to amortization, along with their useful lives (in millions):
As of June 30,
2009 2008
Franchise agreements up to 26 years $ 140.6 $ 109.8
Favorable leases up to 20 years 48.8 35.8
$ 189.4 $ 145.6
Accumulated amortization (31.8) (25.8)
Total, Net $ 157.6 $ 119.8
The $30.8 million and $13.0 million increase in the value of franchise agreements and favorable leases, respectively, is
attributable to the acquisition of franchise restaurants in the year ended June 30, 2009.
As of June 30, 2009, estimated future amortization expense of intangible assets subject to amortization for each of the years ended
June 30, is $8.4 million in 2010 and 2011, $8.3 million in 2012 and 2013, $8.2 million in 2014 and $116.0 million thereafter.
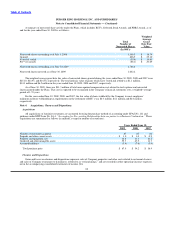
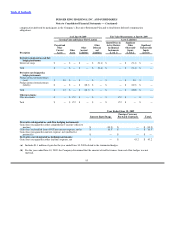
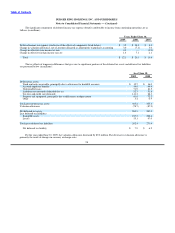
Note 10. Earnings Per Share
Basic and diluted earnings per share were calculated as follows (in millions):
Years Ended June 30,
2009 2008 2007
Numerator:
Numerator for basic and diluted earnings per share:
Net income $ 200.1 $ 189.6 $ 148.1
Denominator:
Weighted average shares — basic 134.8 135.1 133.9
Effect of dilutive securities 2.0 2.5 2.9
Weighted average shares — diluted 136.8 137.6 136.8
Basic earnings per share $ 1.48 $ 1.40 $ 1.11
Diluted earnings per share $ 1.46 $ 1.38 $ 1.08
For the years ended June 30, 2009, 2008 and 2007 there were 2.4 million, 0.8 million and 1.4 million anti−dilutive stock options
outstanding, respectively.
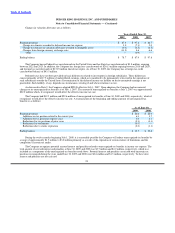
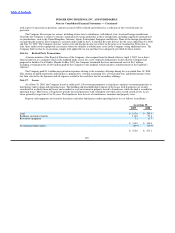
Note 11. Other Accrued Liabilities and Other Liabilities
Included in other accrued liabilities (current) as of June 30, 2009 and 2008, were accrued payroll and employee−related benefit
costs totaling $69.4 million and $84.2 million, respectively. The decrease in payroll and employee−related benefit costs of $14.8 million
is primarily due to the timing of payroll periods during fiscal 2009, as compared to prior fiscal year.
Included in other liabilities (non−current) as of June 30, 2009 and 2008, were accrued pension liabilities of $54.0 million and
$53.8 million, respectively; interest rate swap liabilities of $32.4 million and $10.1 million, respectively; casualty insurance reserves of
$27.7 million and $27.6 million, respectively; retiree health benefits of $21.1 million and $21.4 million, respectively; and liabilities for
unfavorable leases of $155.5 million and $189.6 million, respectively. The $34.1 million decrease in liabilities for unfavorable leases is
primarily attributable to amortization taken during fiscal year 2009 and an $11.6 million impact from foreign currency translation.
91