Burger King 2009 Annual Report Download - page 45
Download and view the complete annual report
Please find page 45 of the 2009 Burger King annual report below. You can navigate through the pages in the report by either clicking on the pages listed below, or by using the keyword search tool below to find specific information within the annual report.-
 1
1 -
2
-
3
-
4
-
5
-
6
-
7
-
8
-
9
-
10
-
11
-
12
-
13
-
14
-
15
-
16
-
17
-
18
-
19
-
20
-
21
-
22
-
23
-
24
-
25
-
26
-
27
-
28
-
29
-
30
-
31
-
32
-
33
-
34
-
 35
35 -
 36
36 -
 37
37 -
 38
38 -
 39
39 -
 40
40 -
 41
41 -
 42
42 -
 43
43 -
 44
44 -
 45
45 -
 46
46 -
 47
47 -
 48
48 -
 49
49 -
 50
50 -
 51
51 -
 52
52 -
 53
53 -
 54
54 -
 55
55 -
56
-
57
-
58
-
59
-
60
-
61
-
62
-
63
-
64
-
65
-
66
-
67
-
68
-
69
-
70
-
71
-
72
-
73
-
74
-
75
-
76
-
77
-
78
-
79
-
80
-
81
-
82
-
83
-
84
-
85
-
86
-
87
-
88
-
89
-
90
-
91
-
92
-
93
-
94
-
95
-
96
-
97
-
98
-
99
-
100
-
101
-
102
-
103
-
104
-
105
-
106
-
107
-
108
-
109
-
110
-
111
-
112
-
113
-
114
-
115
-
116
-
117
-
118
-
119
-
120
-
121
-
122
-
123
-
124
-
125
-
126
-
127
-
128
-
129
-
130
-
131
-
132
-
133
-
134
-
135
-
136
-
137
-
138
-
139
-
140
-
141
-
142
-
143
-
144
-
145
-
146
-
147
-
148
-
149
-
150
-
151
-
152
-
153
-
154
-
155
-
156
-
157
-
158
-
159
-
160
-
161
-
162
-
163
-
164
-
165
-
166
-
167
-
168
-
169
-
170
-
171
-
172
-
173
-
174
-
175
-
176
-
177
-
178
-
179
-
180
-
181
-
182
-
183
-
184
-
185
-
186
-
187
-
188
-
189
-
190
-
191
-
192
-
193
-
194
-
195
-
196
-
197
-
198
-
199
-
200
-
201
-
202
-
203
-
204
-
205
-
206
-
207
-
208
-
209
-
210
-
211
-
212
-
213
-
214
-
215
-
216
-
217
-
218
-
219
-
220
-
221
-
222
-
223
-
224
-
225
 |
 |

Table of Contents
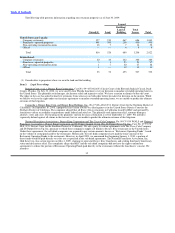
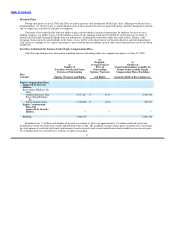
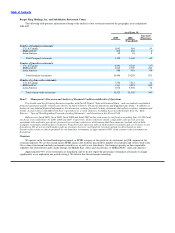
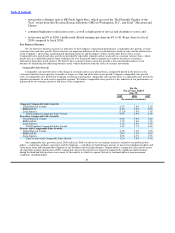
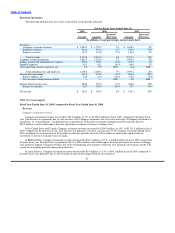
Burger King Holdings, Inc. and Subsidiaries Restaurant Count
The following table presents information relating to the analysis of our restaurant count for the geographic areas and periods
indicated.
As of June 30, Increase/
2009 2008 (Decrease)
(Unaudited)
Number of Company restaurants:
U.S. & Canada 1,043 984 59
EMEA/APAC 294 292 2
Latin America 92 84 8
Total Company restaurants 1,429 1,360 69
Number of franchise restaurants:
U.S. & Canada 6,491 6,528 (37)
EMEA/APAC 3,019 2,759 260
Latin America 986 918 68
Total franchise restaurants 10,496 10,205 291
Number of system−wide restaurants:
U.S. & Canada 7,534 7,512 22
EMEA/APAC 3,313 3,051 262
Latin America 1,078 1,002 76
Total system−wide restaurants 11,925 11,565 360
Item 7. Management’s Discussion and Analysis of Financial Condition and Results of Operations
You should read the following discussion together with Part II, Item 6 “Selected Financial Data” and our audited consolidated
financial statements and the related notes thereto included in Item 8 “Financial Statements and Supplementary Data.” In addition to
historical consolidated financial information, this discussion contains forward−looking statements that reflect our plans, estimates and
beliefs. Actual results could differ from these expectations as a result of factors including those described under Item 1A, “Risk
Factors,” “Special Note Regarding Forward−Looking Statements” and elsewhere in this Form 10−K.
References to fiscal 2010, fiscal 2009, fiscal 2008 and fiscal 2007 in this section are to our fiscal year ending June 30, 2010 and
our fiscal years ended June 30, 2009, 2008 and 2007, respectively. Unless otherwise stated, comparable sales growth, average
restaurant sales and sales growth are presented on a system−wide basis, which means that these measures include sales at both
Company restaurants and franchise restaurants. Franchise sales represent sales at all franchise restaurants and are revenues to our
franchisees. We do not record franchise sales as revenues; however, our franchise revenues include royalties based on sales.
System−wide results are driven primarily by our franchise restaurants, as approximately 90% of our system−wide restaurants are
franchised.
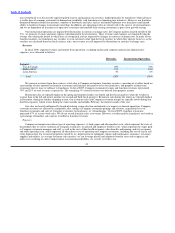
Overview
We operate in the fast food hamburger restaurant, or FFHR, category of the quick service restaurant, or QSR, segment of the
restaurant industry. We are the second largest FFHR chain in the world as measured by number of restaurants and system−wide sales.
Our system of restaurants includes restaurants owned by us, as well as our franchisees. Our business operates in three reportable
segments: the United States and Canada; Europe, the Middle East, Africa and Asia Pacific, or EMEA/APAC; and Latin America.
Approximately 90% of our restaurants are franchised, and we do not expect the percentage of franchise restaurants to change
significantly as we implement our growth strategy. We believe that this restaurant ownership
43