Burger King 2009 Annual Report Download - page 105
Download and view the complete annual report
Please find page 105 of the 2009 Burger King annual report below. You can navigate through the pages in the report by either clicking on the pages listed below, or by using the keyword search tool below to find specific information within the annual report.-
 1
1 -
2
-
3
-
4
-
5
-
6
-
7
-
8
-
9
-
10
-
11
-
12
-
13
-
14
-
15
-
16
-
17
-
18
-
19
-
20
-
21
-
22
-
23
-
24
-
25
-
26
-
27
-
28
-
29
-
30
-
31
-
32
-
33
-
34
-
35
-
36
-
37
-
38
-
39
-
40
-
41
-
42
-
43
-
44
-
45
-
46
-
47
-
48
-
49
-
50
-
51
-
52
-
53
-
54
-
55
-
56
-
57
-
58
-
59
-
60
-
61
-
62
-
63
-
64
-
65
-
66
-
67
-
68
-
69
-
70
-
71
-
72
-
73
-
74
-
75
-
76
-
77
-
78
-
79
-
80
-
81
-
82
-
83
-
84
-
85
-
86
-
87
-
88
-
89
-
90
-
91
-
92
-
93
-
94
-
 95
95 -
 96
96 -
 97
97 -
 98
98 -
 99
99 -
 100
100 -
 101
101 -
 102
102 -
 103
103 -
 104
104 -
 105
105 -
 106
106 -
 107
107 -
 108
108 -
 109
109 -
 110
110 -
 111
111 -
 112
112 -
 113
113 -
 114
114 -
 115
115 -
116
-
117
-
118
-
119
-
120
-
121
-
122
-
123
-
124
-
125
-
126
-
127
-
128
-
129
-
130
-
131
-
132
-
133
-
134
-
135
-
136
-
137
-
138
-
139
-
140
-
141
-
142
-
143
-
144
-
145
-
146
-
147
-
148
-
149
-
150
-
151
-
152
-
153
-
154
-
155
-
156
-
157
-
158
-
159
-
160
-
161
-
162
-
163
-
164
-
165
-
166
-
167
-
168
-
169
-
170
-
171
-
172
-
173
-
174
-
175
-
176
-
177
-
178
-
179
-
180
-
181
-
182
-
183
-
184
-
185
-
186
-
187
-
188
-
189
-
190
-
191
-
192
-
193
-
194
-
195
-
196
-
197
-
198
-
199
-
200
-
201
-
202
-
203
-
204
-
205
-
206
-
207
-
208
-
209
-
210
-
211
-
212
-
213
-
214
-
215
-
216
-
217
-
218
-
219
-
220
-
221
-
222
-
223
-
224
-
225
 |
 |

Table of Contents
BURGER KING HOLDINGS, INC. AND SUBSIDIARIES
Notes to Consolidated Financial Statements — (Continued)
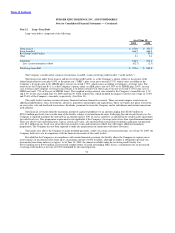
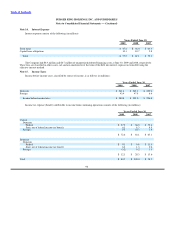
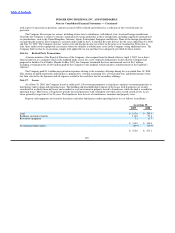
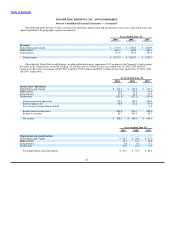
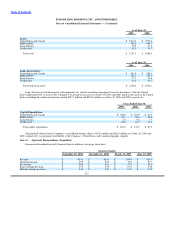
Property revenues are comprised primarily of rental income from operating leases and earned income on direct financing leases
with franchisees as follows (in millions):
Years Ended June 30,
2009 2008 2007
Rental income:
Minimum $ 69.9 $ 78.9 $ 76.1
Contingent 20.6 20.7 16.2
Total rental income 90.5 99.6 92.3
Earned income on direct financing leases 23.0 22.0 23.9
Total property revenues $ 113.5 $ 121.6 $ 116.2
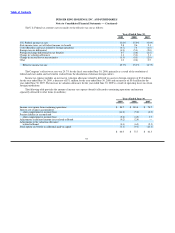
Rent expense associated with the lease commitments is as follows (in millions):
Years Ended June 30,
2009 2008 2007
Rental expense:
Minimum $ 166.5 $ 150.2 $ 154.7
Contingent 7.7 7.4 7.3
Amortization of favorable and unfavorable leases contracts, net (18.2) (24.2) (24.6)
Total rental expense $ 156.0 $ 133.4 $ 137.4
Favorable leases are amortized on a straight line basis over the remaining lease term for a period of up to 20 years, with
amortization expense included in occupancy and other operating costs and property expenses in the consolidated statements of income.
Unfavorable leases are amortized over a period of up to 20 years as a reduction in occupancy and other operating costs and property
expenses in the consolidated statements of income.
Amortization of favorable leases totaled $2.6 million, $1.8 million and $2.1 million for the years ended June 30, 2009, 2008 and
2007, respectively. Amortization of unfavorable leases totaled $20.8 million, $26.0 million and $26.7 million for the years ended
June 30, 2009, 2008 and 2007, respectively.
Favorable leases, net of accumulated amortization totaled $36.5 million and $25.1 million as of June 30, 2009 and June 30, 2008,
respectively, and are classified as intangible assets in the accompanying consolidated balance sheets (See Note 9). Unfavorable leases,
net of accumulated amortization totaled $155.5 million and $189.6 million as of June 30, 2009 and June 30, 2008, respectively, and are
classified within other deferrals and liabilities in the accompanying consolidated balance sheets.
As of June 30, 2009, estimated future amortization expense of favorable lease contracts subject to amortization for each of the
years ended June 30 is $2.5 million in 2010 and 2011, $2.4 million in 2012, $2.3 million in 2013 and 2014 and $24.5 million thereafter.
As of June 30, 2009, estimated future amortization expense of unfavorable lease contracts subject to amortization for each of the years
ended June 30 is $17.9 million in 2010, $16.4 million in 2011, $15.2 million in 2012, $14.4 million in 2013, $13.4 million in 2014 and
$78.2 million thereafter.
102