Burger King 2009 Annual Report Download - page 44
Download and view the complete annual report
Please find page 44 of the 2009 Burger King annual report below. You can navigate through the pages in the report by either clicking on the pages listed below, or by using the keyword search tool below to find specific information within the annual report.-
 1
1 -
2
-
3
-
4
-
5
-
6
-
7
-
8
-
9
-
10
-
11
-
12
-
13
-
14
-
15
-
16
-
17
-
18
-
19
-
20
-
21
-
22
-
23
-
24
-
25
-
26
-
27
-
28
-
29
-
30
-
31
-
32
-
33
-
 34
34 -
 35
35 -
 36
36 -
 37
37 -
 38
38 -
 39
39 -
 40
40 -
 41
41 -
 42
42 -
 43
43 -
 44
44 -
 45
45 -
 46
46 -
 47
47 -
 48
48 -
 49
49 -
 50
50 -
 51
51 -
 52
52 -
 53
53 -
 54
54 -
55
-
56
-
57
-
58
-
59
-
60
-
61
-
62
-
63
-
64
-
65
-
66
-
67
-
68
-
69
-
70
-
71
-
72
-
73
-
74
-
75
-
76
-
77
-
78
-
79
-
80
-
81
-
82
-
83
-
84
-
85
-
86
-
87
-
88
-
89
-
90
-
91
-
92
-
93
-
94
-
95
-
96
-
97
-
98
-
99
-
100
-
101
-
102
-
103
-
104
-
105
-
106
-
107
-
108
-
109
-
110
-
111
-
112
-
113
-
114
-
115
-
116
-
117
-
118
-
119
-
120
-
121
-
122
-
123
-
124
-
125
-
126
-
127
-
128
-
129
-
130
-
131
-
132
-
133
-
134
-
135
-
136
-
137
-
138
-
139
-
140
-
141
-
142
-
143
-
144
-
145
-
146
-
147
-
148
-
149
-
150
-
151
-
152
-
153
-
154
-
155
-
156
-
157
-
158
-
159
-
160
-
161
-
162
-
163
-
164
-
165
-
166
-
167
-
168
-
169
-
170
-
171
-
172
-
173
-
174
-
175
-
176
-
177
-
178
-
179
-
180
-
181
-
182
-
183
-
184
-
185
-
186
-
187
-
188
-
189
-
190
-
191
-
192
-
193
-
194
-
195
-
196
-
197
-
198
-
199
-
200
-
201
-
202
-
203
-
204
-
205
-
206
-
207
-
208
-
209
-
210
-
211
-
212
-
213
-
214
-
215
-
216
-
217
-
218
-
219
-
220
-
221
-
222
-
223
-
224
-
225
 |
 |

Table of Contents
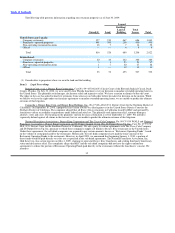
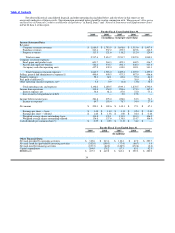
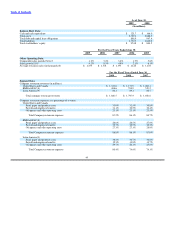
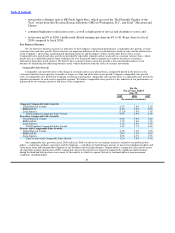
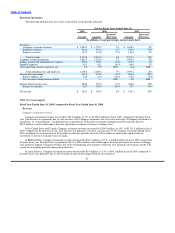
The following table is a reconciliation of our net income to EBITDA:
For the Fiscal Years Ended June 30,
2009 2008 2007 2006 2005
(In millions)
Net income $ 200.1 $ 189.6 $ 148.1 $ 27.1 $ 47.3
Interest expense, net 54.6 61.2 67.0 72.0 73.1
Loss on early extinguishment of debt — — 0.8 17.8 —
Income tax expense 84.7 103.4 78.7 54.4 27.0
Depreciation and amortization 98.1 95.6 88.8 87.9 73.5
EBITDA $ 437.5 $ 449.8 $ 383.4 $ 259.2 $ 220.9
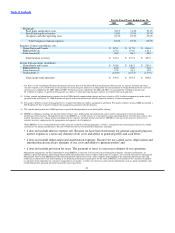
(5) Comparable sales growth and sales growth are analyzed on a constant currency basis, which means they are calculated using the same exchange rate over
the periods under comparison, to remove the effects of currency fluctuations from these trend analyses. We believe these constant currency measures
provide a more meaningful analysis of our business by identifying the underlying business trends, without distortion from the effect of foreign currency
movements.
(6) Unless otherwise stated, comparable sales growth, sales growth and average restaurant sales are presented on a system−wide basis, which means they
include Company restaurants and franchise restaurants. Franchise sales represent sales at all franchise restaurants and are revenues to our franchisees. We do
not record franchise sales as revenues. However, our royalty revenues are calculated based on a percentage of franchise sales. See “Management’s
Discussion and Analysis of Financial Condition and Results of Operations — Key Business Measures.”
(7) Comparable sales growth refers to the change in restaurant sales in one period from a comparable period for restaurants that have been open for thirteen
months or longer.
(8) Refers to our operations in Europe, the Middle East, Africa and Asia Pacific.
(9) Refers to our operations in Mexico, Central and South America, the Caribbean and Puerto Rico.
(10) Franchise revenues consist primarily of royalties paid by franchisees. Royalties earned are based on a percentage of franchise sales, which were
$12.8 billion, $12.9 billion and $11.6 billion for fiscal 2009, 2008, and 2007, respectively. Franchise sales are sales at all franchise restaurants and are
revenues to our franchisees. We do not record franchise sales as revenues.
(11) Unallocated includes corporate support costs in areas such as facilities, finance, human resources, information technology, legal, marketing, and supply
chain management, which benefit all of the Company’s geographic segments and system wide restaurants and are not allocated specifically to any of the
geographic segments.
42