Burger King 2009 Annual Report Download - page 64
Download and view the complete annual report
Please find page 64 of the 2009 Burger King annual report below. You can navigate through the pages in the report by either clicking on the pages listed below, or by using the keyword search tool below to find specific information within the annual report.-
 1
1 -
2
-
3
-
4
-
5
-
6
-
7
-
8
-
9
-
10
-
11
-
12
-
13
-
14
-
15
-
16
-
17
-
18
-
19
-
20
-
21
-
22
-
23
-
24
-
25
-
26
-
27
-
28
-
29
-
30
-
31
-
32
-
33
-
34
-
35
-
36
-
37
-
38
-
39
-
40
-
41
-
42
-
43
-
44
-
45
-
46
-
47
-
48
-
49
-
50
-
51
-
52
-
53
-
 54
54 -
 55
55 -
 56
56 -
 57
57 -
 58
58 -
 59
59 -
 60
60 -
 61
61 -
 62
62 -
 63
63 -
 64
64 -
 65
65 -
 66
66 -
 67
67 -
 68
68 -
 69
69 -
 70
70 -
 71
71 -
 72
72 -
 73
73 -
 74
74 -
75
-
76
-
77
-
78
-
79
-
80
-
81
-
82
-
83
-
84
-
85
-
86
-
87
-
88
-
89
-
90
-
91
-
92
-
93
-
94
-
95
-
96
-
97
-
98
-
99
-
100
-
101
-
102
-
103
-
104
-
105
-
106
-
107
-
108
-
109
-
110
-
111
-
112
-
113
-
114
-
115
-
116
-
117
-
118
-
119
-
120
-
121
-
122
-
123
-
124
-
125
-
126
-
127
-
128
-
129
-
130
-
131
-
132
-
133
-
134
-
135
-
136
-
137
-
138
-
139
-
140
-
141
-
142
-
143
-
144
-
145
-
146
-
147
-
148
-
149
-
150
-
151
-
152
-
153
-
154
-
155
-
156
-
157
-
158
-
159
-
160
-
161
-
162
-
163
-
164
-
165
-
166
-
167
-
168
-
169
-
170
-
171
-
172
-
173
-
174
-
175
-
176
-
177
-
178
-
179
-
180
-
181
-
182
-
183
-
184
-
185
-
186
-
187
-
188
-
189
-
190
-
191
-
192
-
193
-
194
-
195
-
196
-
197
-
198
-
199
-
200
-
201
-
202
-
203
-
204
-
205
-
206
-
207
-
208
-
209
-
210
-
211
-
212
-
213
-
214
-
215
-
216
-
217
-
218
-
219
-
220
-
221
-
222
-
223
-
224
-
225
 |
 |

Table of Contents
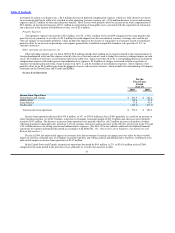
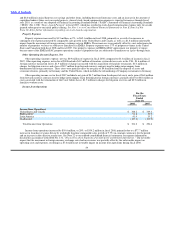
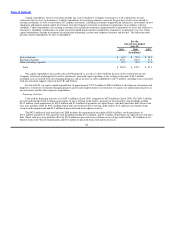
Capital expenditures for new restaurants include the costs to build new Company restaurants as well as properties for new
restaurants that we lease to franchisees. Capital expenditures for existing restaurants consist of the purchase of real estate related to
existing restaurants, as well as renovations to Company restaurants, including restaurants acquired from franchisees, investments in new
equipment and normal annual capital investments for each Company restaurant to maintain its appearance in accordance with our
standards. Capital expenditures for existing restaurants also include investments in improvements to properties we lease and sublease to
franchisees, including contributions we make toward leasehold improvements completed by franchisees on properties we own. Other
capital expenditures include investments in information technology systems and corporate furniture and fixtures. The following table
presents capital expenditures by type of expenditure:
For the
Fiscal Years Ended
June 30,
2009 2008 2007
(In millions)
New restaurants $ 65.4 $ 55.4 $ 22.9
Existing restaurants 110.1 102.0 47.4
Other, including corporate 28.5 20.8 17.0
Total $ 204.0 $ 178.2 $ 87.3
Our capital expenditures increased in fiscal 2009 primarily as a result of a $10.0 million increase in the construction of new
Company restaurants and properties leased to franchisees, increased capital spending at our existing restaurants of $8.1 million,
including costs associated with our reimaging program, and an increase in other expenditures of $7.8 million, including costs associated
with our restaurant support centers in the U.K. and Turkey.
For fiscal 2010, we expect capital expenditures of approximately $175.0 million to $200.0 million to develop new restaurants and
properties, to fund our restaurant reimaging program and to make improvements to restaurants we acquire, for operational initiatives in
our restaurants and for other corporate expenditures.
Financing Activities
Cash used by financing activities was $105.5 million in fiscal 2009, compared to $62.0 million in fiscal 2008. The $105.5 million
of cash used includes $144.3 million of payments on our revolving credit facility, payment of four quarterly cash dividends totaling
$34.1 million, stock repurchases of $20.3 million and $7.4 million of payments on capital leases, term debt and other debt. These cash
uses were partially offset by $94.3 million of proceeds received from our revolving credit facility, $3.3 million in tax benefits from
stock−based compensation and $3.0 million of proceeds from stock option exercises.
The $62.0 million of cash used in fiscal 2008 includes the repayment of term debt of $50.0 million, stock repurchases of
$35.4 million, payment of four quarterly cash dividends totaling $34.2 million, and $5.5 million of payments on capital leases and other
debt. These cash uses were partially offset by $50.0 million in proceeds received from our revolving credit facility, $9.3 million in tax
benefits from stock−based compensation and $3.8 million of proceeds from stock option exercises.
62