Burger King 2009 Annual Report Download - page 106
Download and view the complete annual report
Please find page 106 of the 2009 Burger King annual report below. You can navigate through the pages in the report by either clicking on the pages listed below, or by using the keyword search tool below to find specific information within the annual report.-
 1
1 -
2
-
3
-
4
-
5
-
6
-
7
-
8
-
9
-
10
-
11
-
12
-
13
-
14
-
15
-
16
-
17
-
18
-
19
-
20
-
21
-
22
-
23
-
24
-
25
-
26
-
27
-
28
-
29
-
30
-
31
-
32
-
33
-
34
-
35
-
36
-
37
-
38
-
39
-
40
-
41
-
42
-
43
-
44
-
45
-
46
-
47
-
48
-
49
-
50
-
51
-
52
-
53
-
54
-
55
-
56
-
57
-
58
-
59
-
60
-
61
-
62
-
63
-
64
-
65
-
66
-
67
-
68
-
69
-
70
-
71
-
72
-
73
-
74
-
75
-
76
-
77
-
78
-
79
-
80
-
81
-
82
-
83
-
84
-
85
-
86
-
87
-
88
-
89
-
90
-
91
-
92
-
93
-
94
-
95
-
 96
96 -
 97
97 -
 98
98 -
 99
99 -
 100
100 -
 101
101 -
 102
102 -
 103
103 -
 104
104 -
 105
105 -
 106
106 -
 107
107 -
 108
108 -
 109
109 -
 110
110 -
 111
111 -
 112
112 -
 113
113 -
 114
114 -
 115
115 -
 116
116 -
117
-
118
-
119
-
120
-
121
-
122
-
123
-
124
-
125
-
126
-
127
-
128
-
129
-
130
-
131
-
132
-
133
-
134
-
135
-
136
-
137
-
138
-
139
-
140
-
141
-
142
-
143
-
144
-
145
-
146
-
147
-
148
-
149
-
150
-
151
-
152
-
153
-
154
-
155
-
156
-
157
-
158
-
159
-
160
-
161
-
162
-
163
-
164
-
165
-
166
-
167
-
168
-
169
-
170
-
171
-
172
-
173
-
174
-
175
-
176
-
177
-
178
-
179
-
180
-
181
-
182
-
183
-
184
-
185
-
186
-
187
-
188
-
189
-
190
-
191
-
192
-
193
-
194
-
195
-
196
-
197
-
198
-
199
-
200
-
201
-
202
-
203
-
204
-
205
-
206
-
207
-
208
-
209
-
210
-
211
-
212
-
213
-
214
-
215
-
216
-
217
-
218
-
219
-
220
-
221
-
222
-
223
-
224
-
225
 |
 |

Table of Contents
BURGER KING HOLDINGS, INC. AND SUBSIDIARIES
Notes to Consolidated Financial Statements — (Continued)
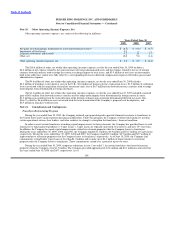
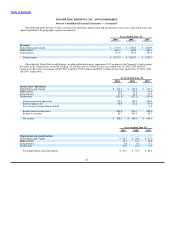
Note 18. Stockholders’ Equity
Dividends Paid
During each of the years ended June 30, 2009 and 2008, the Company declared four quarterly cash dividends of $0.0625 per share
on its common stock and two quarterly cash dividends of $0.0625 per share on its common stock during the year ended June 30, 2007.
We paid quarterly dividends of $0.0625 per share of common stock for the third and fourth quarter of the year ended June 30, 2007,
resulting in $16.9 million of cash payments to shareholders of record. Total dividends paid by the Company during each of the years
ended June 30, 2009, 2008, and 2007 was $34.1 million, $34.2 million, and $16.9 million, respectively.
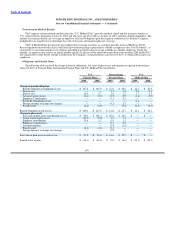
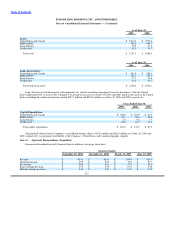
Accumulated Other Comprehensive Income (Loss)
The following table displays the change in the components of accumulated other comprehensive income (loss) (in millions):
Accumulated
Foreign Other
Currency Comprehensive
Derivatives Pensions Translation Income (loss)
Balance at June 30, 2006 $ (15.5) $ 1.7 $ (0.8) $ (14.6)
Translation Adjustments — — 5.4 5.4
Net change in fair value of derivatives, net of tax of
$3.4 million 5.4 — — 5.4
Amounts reclassified into earnings from terminated swaps,
net of tax of $1.5 million 2.5 — — 2.5
Adjustment to initially apply SFAS 158, net of tax of
$3.7 million — (6.2) — (6.2)
Balance at June 30, 2007 (7.6) (4.5) 4.6 (7.5)
Translation Adjustments — — 1.7 1.7
Net change in fair value of derivatives, net of tax of
$3.9 million 6.4 — — 6.4
Amounts reclassified into earnings from terminated swaps,
net of tax of $1.1 million 1.3 — — 1.3
Pension and post−retirement benefit plans, net of tax of
$4.5 million — 6.5 — 6.5
Balance at June 30, 2008 0.1 2.0 6.3 8.4
Translation Adjustments — — 6.0 6.0
Net change in fair value of derivatives, net of tax of
$10.6 million 16.8 — — 16.8
Amounts reclassified into earnings from terminated swaps,
net of tax of $0.4 million 0.9 — — 0.9
Pension and post−retirement benefit plans, net of tax of
$9.2 million — 13.8 — 13.8
Balance at June 30, 2009 $ 17.8 $ 15.8 $ 12.3 $ 45.9
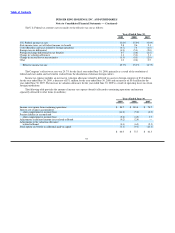
Note 19. Pension and Post Retirement Medical Benefits
Pension Benefits
The Company sponsors noncontributory defined benefit pension plans for its salaried employees in the United States (the
“U.S. Pension Plans”) and certain employees in the United Kingdom, Germany and Switzerland (the “International Pension Plans”).
Effective December 31, 2005, all benefits accrued under the U.S. Pension Plans were frozen at the benefit level attained as of that date.
103