Burger King 2009 Annual Report Download - page 47
Download and view the complete annual report
Please find page 47 of the 2009 Burger King annual report below. You can navigate through the pages in the report by either clicking on the pages listed below, or by using the keyword search tool below to find specific information within the annual report.-
 1
1 -
2
-
3
-
4
-
5
-
6
-
7
-
8
-
9
-
10
-
11
-
12
-
13
-
14
-
15
-
16
-
17
-
18
-
19
-
20
-
21
-
22
-
23
-
24
-
25
-
26
-
27
-
28
-
29
-
30
-
31
-
32
-
33
-
34
-
35
-
36
-
 37
37 -
 38
38 -
 39
39 -
 40
40 -
 41
41 -
 42
42 -
 43
43 -
 44
44 -
 45
45 -
 46
46 -
 47
47 -
 48
48 -
 49
49 -
 50
50 -
 51
51 -
 52
52 -
 53
53 -
 54
54 -
 55
55 -
 56
56 -
 57
57 -
58
-
59
-
60
-
61
-
62
-
63
-
64
-
65
-
66
-
67
-
68
-
69
-
70
-
71
-
72
-
73
-
74
-
75
-
76
-
77
-
78
-
79
-
80
-
81
-
82
-
83
-
84
-
85
-
86
-
87
-
88
-
89
-
90
-
91
-
92
-
93
-
94
-
95
-
96
-
97
-
98
-
99
-
100
-
101
-
102
-
103
-
104
-
105
-
106
-
107
-
108
-
109
-
110
-
111
-
112
-
113
-
114
-
115
-
116
-
117
-
118
-
119
-
120
-
121
-
122
-
123
-
124
-
125
-
126
-
127
-
128
-
129
-
130
-
131
-
132
-
133
-
134
-
135
-
136
-
137
-
138
-
139
-
140
-
141
-
142
-
143
-
144
-
145
-
146
-
147
-
148
-
149
-
150
-
151
-
152
-
153
-
154
-
155
-
156
-
157
-
158
-
159
-
160
-
161
-
162
-
163
-
164
-
165
-
166
-
167
-
168
-
169
-
170
-
171
-
172
-
173
-
174
-
175
-
176
-
177
-
178
-
179
-
180
-
181
-
182
-
183
-
184
-
185
-
186
-
187
-
188
-
189
-
190
-
191
-
192
-
193
-
194
-
195
-
196
-
197
-
198
-
199
-
200
-
201
-
202
-
203
-
204
-
205
-
206
-
207
-
208
-
209
-
210
-
211
-
212
-
213
-
214
-
215
-
216
-
217
-
218
-
219
-
220
-
221
-
222
-
223
-
224
-
225
 |
 |

Table of Contents
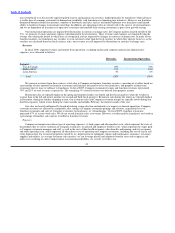
continued focus on increasing average restaurant sales will result in long−term improved profitability to our restaurants system−wide.
We promote our brand and products by advertising in all the countries and territories in which we operate. In countries where we
have Company restaurants, such as the United States, Canada, the U.K. and Germany, we manage an advertising fund for that country
by collecting required advertising contributions from Company and franchise restaurants and purchasing advertising and other
marketing initiatives on behalf of all Burger King restaurants in that country. These advertising contributions are based on a percentage
of sales at Company and franchise restaurants. We do not record advertising contributions collected from franchisees as revenues, or
expenditures of these contributions as expenses. Amounts which are contributed to the advertising funds by Company restaurants are
recorded as selling expenses. In countries where we manage an advertising fund, we plan the marketing calendar in advance based on
expected contributions into the fund for that year. To the extent that contributions received exceed advertising and promotional
expenditures, the excess contributions are recorded as accrued advertising liability on our consolidated balance sheets. We may also
make discretionary contributions into these funds, which are also recorded as selling expenses. In the past, we have made discretionary
contributions to fund deficit balances of the advertising funds.
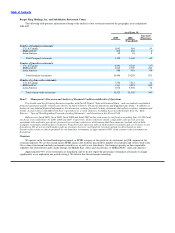
Our selling, general and administrative expenses include the costs of field management for Company and franchise restaurants;
costs of our operational excellence programs (including program staffing, training and Clean & Safe certifications); corporate overhead,
including corporate salaries and facilities; advertising and bad debt expenses, net of recoveries; and amortization of intangible assets.
We believe that our current staffing and structure will allow us to expand our business globally without increasing general and
administrative expenses significantly.
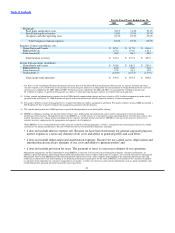
Property expenses include costs of depreciation and rent on properties we lease and sublease to franchisees.
Other operating (income) expenses, net include income and expenses that are not directly derived from the Company’s primary
business such as gains and losses on asset and business disposals, write−offs associated with Company restaurant closures, impairment
charges, settlement losses recorded in connection with acquisitions of franchise operations, gains and losses on foreign currency
transactions, gains and losses on foreign currency forward contracts and other miscellaneous items.
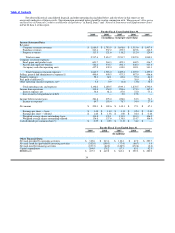
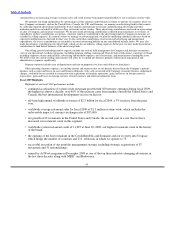
Fiscal 2009 Highlights
Highlights of our fiscal 2009 performance include:
• continued acceleration of system−wide restaurant growth with 360 net new openings during fiscal 2009,
the highest in almost a decade; over 90% of the increase came from markets outside the United States and
Canada, the best international development year in our history;
• all−time high annual worldwide revenues of $2.5 billion for fiscal 2009, a 3% increase from the prior
year;
• worldwide average restaurant sales for fiscal 2009 of $1.3 million system−wide, which includes the
unfavorable impact of currency exchange rates of $55,000;
• net growth of 22 restaurants in the United States and Canada, the second year in a row that we have
increased our restaurant count in this segment;
• worldwide system restaurant count of 11,925 at June 30, 2009, our highest restaurant count in the history
of the brand;
• the opening of the first restaurant in the Czech Republic and Suriname and our re−entry into Uruguay,
which brings the number of countries and U.S. territories in which we operate to 73;
• successful execution of our portfolio management strategy, including strategic acquisitions of 87
restaurants and 51 refranchisings;
• named by Ad Week magazine in December 2008 as one of the top three industry−changing advertisers in
the last three decades along with NIKE® and Budweiser;
45