Burger King 2009 Annual Report Download - page 91
Download and view the complete annual report
Please find page 91 of the 2009 Burger King annual report below. You can navigate through the pages in the report by either clicking on the pages listed below, or by using the keyword search tool below to find specific information within the annual report.-
 1
1 -
2
-
3
-
4
-
5
-
6
-
7
-
8
-
9
-
10
-
11
-
12
-
13
-
14
-
15
-
16
-
17
-
18
-
19
-
20
-
21
-
22
-
23
-
24
-
25
-
26
-
27
-
28
-
29
-
30
-
31
-
32
-
33
-
34
-
35
-
36
-
37
-
38
-
39
-
40
-
41
-
42
-
43
-
44
-
45
-
46
-
47
-
48
-
49
-
50
-
51
-
52
-
53
-
54
-
55
-
56
-
57
-
58
-
59
-
60
-
61
-
62
-
63
-
64
-
65
-
66
-
67
-
68
-
69
-
70
-
71
-
72
-
73
-
74
-
75
-
76
-
77
-
78
-
79
-
80
-
 81
81 -
 82
82 -
 83
83 -
 84
84 -
 85
85 -
 86
86 -
 87
87 -
 88
88 -
 89
89 -
 90
90 -
 91
91 -
 92
92 -
 93
93 -
 94
94 -
 95
95 -
 96
96 -
 97
97 -
 98
98 -
 99
99 -
 100
100 -
 101
101 -
102
-
103
-
104
-
105
-
106
-
107
-
108
-
109
-
110
-
111
-
112
-
113
-
114
-
115
-
116
-
117
-
118
-
119
-
120
-
121
-
122
-
123
-
124
-
125
-
126
-
127
-
128
-
129
-
130
-
131
-
132
-
133
-
134
-
135
-
136
-
137
-
138
-
139
-
140
-
141
-
142
-
143
-
144
-
145
-
146
-
147
-
148
-
149
-
150
-
151
-
152
-
153
-
154
-
155
-
156
-
157
-
158
-
159
-
160
-
161
-
162
-
163
-
164
-
165
-
166
-
167
-
168
-
169
-
170
-
171
-
172
-
173
-
174
-
175
-
176
-
177
-
178
-
179
-
180
-
181
-
182
-
183
-
184
-
185
-
186
-
187
-
188
-
189
-
190
-
191
-
192
-
193
-
194
-
195
-
196
-
197
-
198
-
199
-
200
-
201
-
202
-
203
-
204
-
205
-
206
-
207
-
208
-
209
-
210
-
211
-
212
-
213
-
214
-
215
-
216
-
217
-
218
-
219
-
220
-
221
-
222
-
223
-
224
-
225
 |
 |

Table of Contents
BURGER KING HOLDINGS, INC. AND SUBSIDIARIES
Notes to Consolidated Financial Statements — (Continued)
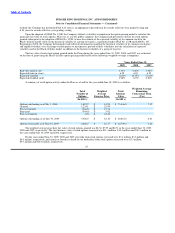
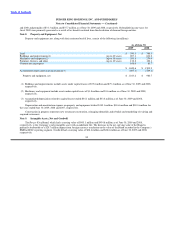
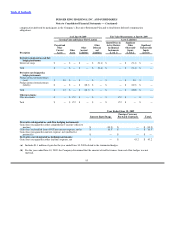
A summary of nonvested share activity under the Plans, which includes RSU’s, Deferred Stock Awards, and PBRS awards, as of
and for the year ended June 30, 2009 is as follows:
Weighted
Average
Total Grant
Number of Date Fair
Nonvested Shares Value
(In 000’s)
Nonvested shares outstanding as of July 1, 2008 1,305.5 $ 18.74
Granted 606.9 $ 25.10
Vested & settled (55.9) $ 19.61
Pre−vest cancels (88.1) $ 20.69
Nonvested shares outstanding as of June 30, 2009 1,768.4
Nonvested shares unvested as of June 30, 2009 1,642.2
The weighted average grant date fair value of nonvested shares granted during the years ended June 30, 2009, 2008 and 2007 were
$25.10, $23.95, and $14.36, respectively. The total intrinsic value of grants which have vested and settled was $1.1 million,
$14.3 million and $6.5 million in the years ended June 30, 2009, 2008,and 2007, respectively.
As of June 30, 2009, there was $31.3 million of total unrecognized compensation cost related to stock options and nonvested
shares granted under the Plans. That cost is expected to be recognized in the Company’s financial statements over a weighted−average
period of 1.74 years.
For the years ended June 30, 2009, 2008, and 2007, the fair value of shares withheld by the Company to meet employees’
minimum statutory withholding tax requirements on the settlement of RSU’s was $0.3 million, $4.1 million and $2.0 million,
respectively.
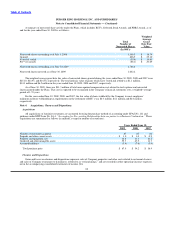
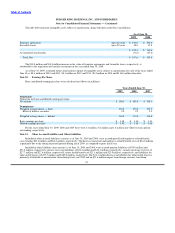
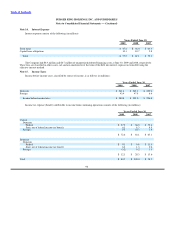
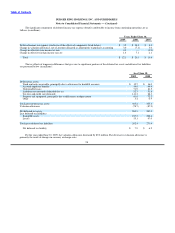
Note 4. Acquisitions, Closures and Dispositions
Acquisitions
All acquisitions of franchise restaurants are accounted for using the purchase method of accounting under SFAS No. 141 and
guidance under EITF Issue No. 04−1, “Accounting for Pre−existing Relationships between parties to a Business Combination.” These
acquisitions are summarized as follows (in millions, except for number of restaurants):
Years Ended June 30,
2009 2008 2007
Number of restaurants acquired 87 83 64
Prepaids and other current assets $ 1.0 $ 1.0 $ 0.9
Property and equipment, net 14.6 13.3 10.2
Goodwill and other intangible assets 55.7 47.5 11.7
Assumed liabilities (3.4) (7.6) (5.9)
Total purchase price $ 67.9 $ 54.2 $ 16.9
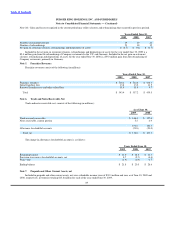
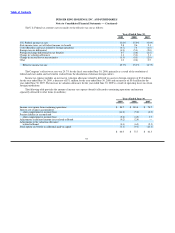
Closures and Dispositions
Gains and losses on closures and dispositions represent sales of Company properties and other costs related to restaurant closures
and sales of Company restaurants to franchisees, referred to as “refranchisings,” and are recorded in other operating (income) expenses,
net in the accompanying consolidated statements of income (See
88