Burger King 2009 Annual Report Download - page 59
Download and view the complete annual report
Please find page 59 of the 2009 Burger King annual report below. You can navigate through the pages in the report by either clicking on the pages listed below, or by using the keyword search tool below to find specific information within the annual report.-
 1
1 -
2
-
3
-
4
-
5
-
6
-
7
-
8
-
9
-
10
-
11
-
12
-
13
-
14
-
15
-
16
-
17
-
18
-
19
-
20
-
21
-
22
-
23
-
24
-
25
-
26
-
27
-
28
-
29
-
30
-
31
-
32
-
33
-
34
-
35
-
36
-
37
-
38
-
39
-
40
-
41
-
42
-
43
-
44
-
45
-
46
-
47
-
48
-
 49
49 -
 50
50 -
 51
51 -
 52
52 -
 53
53 -
 54
54 -
 55
55 -
 56
56 -
 57
57 -
 58
58 -
 59
59 -
 60
60 -
 61
61 -
 62
62 -
 63
63 -
 64
64 -
 65
65 -
 66
66 -
 67
67 -
 68
68 -
 69
69 -
70
-
71
-
72
-
73
-
74
-
75
-
76
-
77
-
78
-
79
-
80
-
81
-
82
-
83
-
84
-
85
-
86
-
87
-
88
-
89
-
90
-
91
-
92
-
93
-
94
-
95
-
96
-
97
-
98
-
99
-
100
-
101
-
102
-
103
-
104
-
105
-
106
-
107
-
108
-
109
-
110
-
111
-
112
-
113
-
114
-
115
-
116
-
117
-
118
-
119
-
120
-
121
-
122
-
123
-
124
-
125
-
126
-
127
-
128
-
129
-
130
-
131
-
132
-
133
-
134
-
135
-
136
-
137
-
138
-
139
-
140
-
141
-
142
-
143
-
144
-
145
-
146
-
147
-
148
-
149
-
150
-
151
-
152
-
153
-
154
-
155
-
156
-
157
-
158
-
159
-
160
-
161
-
162
-
163
-
164
-
165
-
166
-
167
-
168
-
169
-
170
-
171
-
172
-
173
-
174
-
175
-
176
-
177
-
178
-
179
-
180
-
181
-
182
-
183
-
184
-
185
-
186
-
187
-
188
-
189
-
190
-
191
-
192
-
193
-
194
-
195
-
196
-
197
-
198
-
199
-
200
-
201
-
202
-
203
-
204
-
205
-
206
-
207
-
208
-
209
-
210
-
211
-
212
-
213
-
214
-
215
-
216
-
217
-
218
-
219
-
220
-
221
-
222
-
223
-
224
-
225
 |
 |

Table of Contents
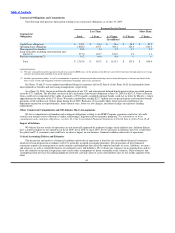
Operating Costs and Expenses
Food, Paper and Product Costs
Total food, paper and product costs increased by $65.1 million, or 13%, to $564.3 million in fiscal 2008, as a result of an 8%
increase in Company restaurant revenues, a significant increase in commodity costs and a $21.0 million unfavorable impact from the
movement of foreign currency exchange rates, primarily in EMEA. As a percentage of Company restaurant revenues, food, paper and
product costs increased 1.3% to 31.4%, primarily due to the increase in commodity and other food costs in the United States and
Canada.
In the United States and Canada, food, paper and product costs increased by $48.1 million, or 14%, to $381.2 million in fiscal
2008, as a result of an 8% increase in Company restaurant revenues in this segment, a significant increase in commodity costs and a
$5.7 million unfavorable impact from the movement of foreign currency exchange rates. Food, paper and product costs as a percentage
of Company restaurant revenues increased 1.7% to 32.5%, primarily due to an increase in beef, cheese, chicken and other food costs,
partially offset by sales of higher margin products.
In EMEA/APAC, food, paper and product costs increased by $14.3 million, or 10%, to $158.2 million in fiscal 2008, primarily as
a result of an 8% increase in Company restaurant revenues in this segment, an increase in commodity costs and a $14.9 million
unfavorable impact from the movement of foreign currency exchange rates. Food, paper and product costs as a percentage of Company
restaurant revenues increased 0.6% to 28.5%, reflecting the unfavorable impact from product mix and commodity pressures during
fiscal 2008.
In Latin America, food, paper and product costs increased by $2.7 million, or 12%, to $24.9 million in fiscal 2008, as a result of a
14% increase in Company restaurant revenues in this segment. As a percentage of revenues, food, paper and product costs remained
relatively unchanged at 36.7% for fiscal 2008 compared to 36.6% for fiscal 2007.
Payroll and Employee Benefits
Payroll and employee benefits costs increased by $42.6 million, or 9%, to $534.7 million in fiscal 2008. This increase was
primarily due to the net addition of 57 Company restaurants in fiscal 2008, additional labor needed to service increased traffic,
inflationary increases in salaries and wages, increases in fringe benefit costs and a $21.3 million unfavorable impact from the movement
of foreign currency exchange rates, primarily in EMEA. As a percentage of Company restaurant revenues, payroll and employee
benefits costs remained relatively unchanged at 29.8% in fiscal 2008 compared to 29.7% in fiscal 2007, reflecting inflationary increases
in salaries and wages, partially offset by worldwide Company comparable sales growth of 2.9% (in constant currencies) for the period.
In the United States and Canada, payroll and employee benefits costs increased by $27.6 million, or 8%, to $356.7 million in fiscal
2008. This increase was primarily due to the net addition of 87 Company restaurants in fiscal 2008, additional labor needed to service
increased traffic, inflationary increases in salaries and wages and a $5.2 million unfavorable impact from the movement of foreign
currency exchange rates in Canada. As a percentage of Company restaurant revenues, payroll and employee benefits costs remained
relatively unchanged at 30.5% in fiscal 2008 compared to 30.4% in fiscal 2007, reflecting inflationary increases in salaries and wages,
partially offset by Company comparable sales growth of 2.6% (in constant currencies) for the period in this segment.
In EMEA/APAC, payroll and employee benefits costs increased by $13.8 million, or 9%, to $169.7 million in fiscal 2008. This
increase was primarily due to an increase in temporary staffing, inflationary increases in salaries and wages, increases in fringe benefit
costs and a $16.1 million unfavorable impact from the movement of foreign currency exchange rates, partially offset by the net
reduction of 37 Company restaurants in fiscal 2008. As a percentage of Company restaurant revenues, payroll and employee benefits
costs increased 0.2% to 30.5% as a result of inflationary increases in salaries and wages and increases in fringe benefit costs, partially
offset by Company comparable sales growth of 3.8% (in constant currencies) for the period in this segment.
In Latin America, payroll and employee benefits increased by $1.2 million, or 17%, to $8.3 million in fiscal 2008. This increase
was primarily due to a net increase of seven Company restaurants during fiscal 2008. As a
57