Burger King 2009 Annual Report Download - page 107
Download and view the complete annual report
Please find page 107 of the 2009 Burger King annual report below. You can navigate through the pages in the report by either clicking on the pages listed below, or by using the keyword search tool below to find specific information within the annual report.-
 1
1 -
2
-
3
-
4
-
5
-
6
-
7
-
8
-
9
-
10
-
11
-
12
-
13
-
14
-
15
-
16
-
17
-
18
-
19
-
20
-
21
-
22
-
23
-
24
-
25
-
26
-
27
-
28
-
29
-
30
-
31
-
32
-
33
-
34
-
35
-
36
-
37
-
38
-
39
-
40
-
41
-
42
-
43
-
44
-
45
-
46
-
47
-
48
-
49
-
50
-
51
-
52
-
53
-
54
-
55
-
56
-
57
-
58
-
59
-
60
-
61
-
62
-
63
-
64
-
65
-
66
-
67
-
68
-
69
-
70
-
71
-
72
-
73
-
74
-
75
-
76
-
77
-
78
-
79
-
80
-
81
-
82
-
83
-
84
-
85
-
86
-
87
-
88
-
89
-
90
-
91
-
92
-
93
-
94
-
95
-
96
-
 97
97 -
 98
98 -
 99
99 -
 100
100 -
 101
101 -
 102
102 -
 103
103 -
 104
104 -
 105
105 -
 106
106 -
 107
107 -
 108
108 -
 109
109 -
 110
110 -
 111
111 -
 112
112 -
 113
113 -
 114
114 -
 115
115 -
 116
116 -
 117
117 -
118
-
119
-
120
-
121
-
122
-
123
-
124
-
125
-
126
-
127
-
128
-
129
-
130
-
131
-
132
-
133
-
134
-
135
-
136
-
137
-
138
-
139
-
140
-
141
-
142
-
143
-
144
-
145
-
146
-
147
-
148
-
149
-
150
-
151
-
152
-
153
-
154
-
155
-
156
-
157
-
158
-
159
-
160
-
161
-
162
-
163
-
164
-
165
-
166
-
167
-
168
-
169
-
170
-
171
-
172
-
173
-
174
-
175
-
176
-
177
-
178
-
179
-
180
-
181
-
182
-
183
-
184
-
185
-
186
-
187
-
188
-
189
-
190
-
191
-
192
-
193
-
194
-
195
-
196
-
197
-
198
-
199
-
200
-
201
-
202
-
203
-
204
-
205
-
206
-
207
-
208
-
209
-
210
-
211
-
212
-
213
-
214
-
215
-
216
-
217
-
218
-
219
-
220
-
221
-
222
-
223
-
224
-
225
 |
 |

Table of Contents
BURGER KING HOLDINGS, INC. AND SUBSIDIARIES
Notes to Consolidated Financial Statements — (Continued)
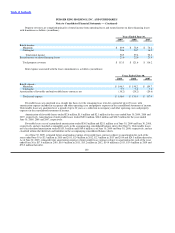
Postretirement Medical Benefits
The Company’s postretirement medical plan (the “U.S. Medical Plan”) provides medical, dental and life insurance benefits to
U.S. salaried retirees hired prior to June 30, 2001 and who were age 40 or older as of June 30, 2001, and their eligible dependents. The
amount of retirement health care coverage an employee will receive depends upon the length of credited service with the Company,
multiplied by an annual factor to determine the value of the post−retirement health care coverage.
The U.S Medical Plan also provides prescription drug coverage to retirees as a primary provider in lieu of Medicare Part D.
Recent legislation enacted will result in the federal government paying a special direct subsidy to employers (the “Part D subsidy”) as
an incentive to encourage employers to continue providing prescription drug coverage to Medicare−eligible employees. Under the
subsidy, an employer may receive an annual amount equal to 28 percent of the allowable retiree drug costs between $295 and $6,000.
The annual effect of the Part D subsidy is reflected in the Company’s estimated future cash flows for the U.S. Medical Plan and is not
significant.
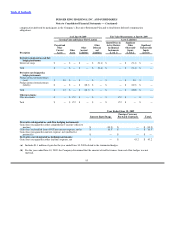
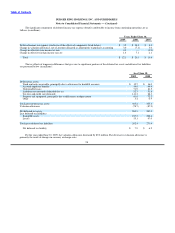
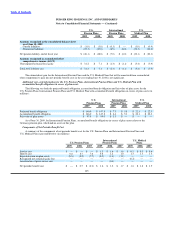
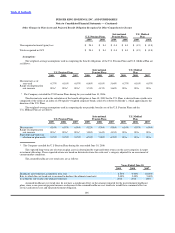
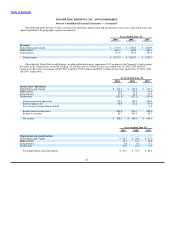
Obligations and Funded Status
The following table sets forth the change in benefit obligations, fair value of plan assets and amounts recognized in the balance
sheets for the U.S. Pension Plans, International Pension Plans and U.S. Medical Plan (in millions):
U.S. International U.S.
Pension Plans Pension Plans Medical Plan
2009 2008 2009 2008 2009 2008
Change in benefit obligation
Benefit obligation at beginning of year $ 147.8 $ 145.9 $ 27.0 $ 20.4 $ 22.3 $ 21.9
Service cost — — 2.1 1.6 0.6 0.5
Interest cost 11.0 8.7 1.6 1.2 1.7 1.3
Actuarial (gains) losses (6.4) (2.2) (3.3) 0.9 (1.8) (0.9)
Employee Contributions — — 0.3 0.2 — —
Part D Rx Subsidy Received — — — — 0.1 —
Foreign currency exchange rate changes — — (4.1) 1.5 — —
Benefits paid (6.4) (4.6) — (0.1) (0.8) (0.5)
Benefit obligation at end of year $ 146.0 $ 147.8 $ 23.6 $ 25.7 $ 22.1 $ 22.3
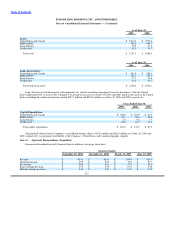
Change in plan assets
Fair value of plan assets at beginning of year $ 99.0 $ 101.3 $ 20.8 $ 18.5 $ — $ —
Actual return on plan assets (19.5) (2.9) 1.2 1.3 — —
Employer contributions 24.8 5.2 0.9 1.1 — —
Employee Contributions — — 0.3 0.2 — —
Actuarial gain/loss — — (3.5) (1.4) — —
Benefits paid (6.4) (4.6) 0.1 — — —
Foreign currency exchange rate changes — — (3.2) — — —
Fair value of plan assets at end of year $ 97.9 $ 99.0 $ 16.6 $ 19.7 $ — $ —
Funded status of plan $ (48.1) $ (48.8) $ (7.0) $ (6.0) $ (22.1) $ (22.3)
104