Burger King 2009 Annual Report Download - page 104
Download and view the complete annual report
Please find page 104 of the 2009 Burger King annual report below. You can navigate through the pages in the report by either clicking on the pages listed below, or by using the keyword search tool below to find specific information within the annual report.-
 1
1 -
2
-
3
-
4
-
5
-
6
-
7
-
8
-
9
-
10
-
11
-
12
-
13
-
14
-
15
-
16
-
17
-
18
-
19
-
20
-
21
-
22
-
23
-
24
-
25
-
26
-
27
-
28
-
29
-
30
-
31
-
32
-
33
-
34
-
35
-
36
-
37
-
38
-
39
-
40
-
41
-
42
-
43
-
44
-
45
-
46
-
47
-
48
-
49
-
50
-
51
-
52
-
53
-
54
-
55
-
56
-
57
-
58
-
59
-
60
-
61
-
62
-
63
-
64
-
65
-
66
-
67
-
68
-
69
-
70
-
71
-
72
-
73
-
74
-
75
-
76
-
77
-
78
-
79
-
80
-
81
-
82
-
83
-
84
-
85
-
86
-
87
-
88
-
89
-
90
-
91
-
92
-
93
-
 94
94 -
 95
95 -
 96
96 -
 97
97 -
 98
98 -
 99
99 -
 100
100 -
 101
101 -
 102
102 -
 103
103 -
 104
104 -
 105
105 -
 106
106 -
 107
107 -
 108
108 -
 109
109 -
 110
110 -
 111
111 -
 112
112 -
 113
113 -
 114
114 -
115
-
116
-
117
-
118
-
119
-
120
-
121
-
122
-
123
-
124
-
125
-
126
-
127
-
128
-
129
-
130
-
131
-
132
-
133
-
134
-
135
-
136
-
137
-
138
-
139
-
140
-
141
-
142
-
143
-
144
-
145
-
146
-
147
-
148
-
149
-
150
-
151
-
152
-
153
-
154
-
155
-
156
-
157
-
158
-
159
-
160
-
161
-
162
-
163
-
164
-
165
-
166
-
167
-
168
-
169
-
170
-
171
-
172
-
173
-
174
-
175
-
176
-
177
-
178
-
179
-
180
-
181
-
182
-
183
-
184
-
185
-
186
-
187
-
188
-
189
-
190
-
191
-
192
-
193
-
194
-
195
-
196
-
197
-
198
-
199
-
200
-
201
-
202
-
203
-
204
-
205
-
206
-
207
-
208
-
209
-
210
-
211
-
212
-
213
-
214
-
215
-
216
-
217
-
218
-
219
-
220
-
221
-
222
-
223
-
224
-
225
 |
 |

Table of Contents
BURGER KING HOLDINGS, INC. AND SUBSIDIARIES
Notes to Consolidated Financial Statements — (Continued)
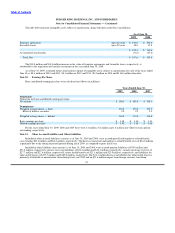
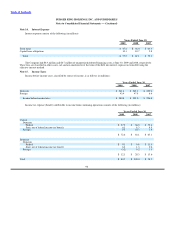
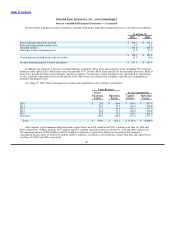
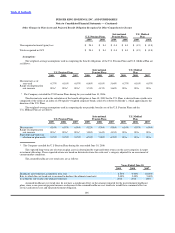
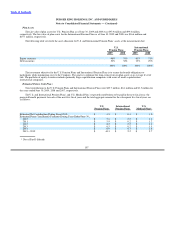
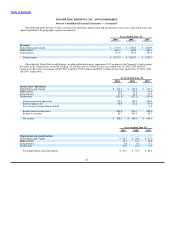
Net investment in property leased to franchisees and other third parties under direct financing leases was as follows (in millions):
As of June 30,
2009 2008
Future minimum rents to be received $ 306.4 $ 306.3
Estimated unguaranteed residual value 4.0 3.9
Unearned income (166.2) (166.1)
Allowance on direct financing leases (0.2) (0.5)
$ 144.0 $ 143.6
Current portion included within trade receivables (8.7) (8.2)
Net investment in property leased to franchisees $ 135.3 $ 135.4
In addition, the Company is the lessee on land, building, equipment, office space and warehouse leases, including 250 restaurant
buildings under capital leases. Initial lease terms are generally 10 to 20 years. Most leases provide for fixed monthly payments. Many of
these leases provide for future rent escalations and renewal options. Certain leases require contingent rent, determined as a percentage
of sales, generally when annual sales exceed specific levels. Most leases also obligate the Company to pay the cost of maintenance,
insurance and property taxes.
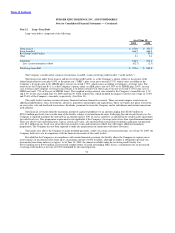
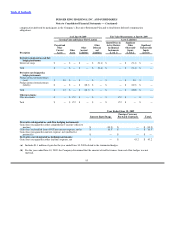
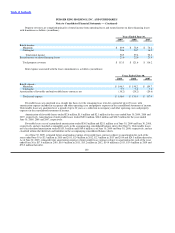
As of June 30, 2009, future minimum lease receipts and commitments were as follows (in millions):
Lease Receipts
Direct Lease Commitments
Financing Operating Capital Operating
Leases Leases Leases Leases
2010 $ 29.2 $ 69.9 $ (14.4) $ (167.1)
2011 28.7 65.4 (14.5) (156.6)
2012 27.5 60.4 (14.1) (147.5)
2013 26.9 57.1 (14.0) (140.8)
2014 25.9 52.3 (14.0) (182.5)
Thereafter 168.2 346.0 (67.1) (833.5)
Total $ 306.4 $ 651.1 $ (138.1) $ (1,628.0)
The Company’s total minimum obligations under capital leases are $138.1 million and $154.4 million as of June 30, 2009 and
2008, respectively. Of these amounts, $67.5 million and $78.1 million represents interest as of June 30, 2009 and 2008, respectively.
The remaining balance of $70.6 million and $76.3 million is reflected as capital lease obligations recorded in the Company’s
consolidated balance sheet, of which $4.8 million and $5.1 million is classified as current portion of long−term debt and capital leases
as of June 30, 2009 and 2008, respectively.
101