Burger King 2009 Annual Report Download - page 110
Download and view the complete annual report
Please find page 110 of the 2009 Burger King annual report below. You can navigate through the pages in the report by either clicking on the pages listed below, or by using the keyword search tool below to find specific information within the annual report.-
 1
1 -
2
-
3
-
4
-
5
-
6
-
7
-
8
-
9
-
10
-
11
-
12
-
13
-
14
-
15
-
16
-
17
-
18
-
19
-
20
-
21
-
22
-
23
-
24
-
25
-
26
-
27
-
28
-
29
-
30
-
31
-
32
-
33
-
34
-
35
-
36
-
37
-
38
-
39
-
40
-
41
-
42
-
43
-
44
-
45
-
46
-
47
-
48
-
49
-
50
-
51
-
52
-
53
-
54
-
55
-
56
-
57
-
58
-
59
-
60
-
61
-
62
-
63
-
64
-
65
-
66
-
67
-
68
-
69
-
70
-
71
-
72
-
73
-
74
-
75
-
76
-
77
-
78
-
79
-
80
-
81
-
82
-
83
-
84
-
85
-
86
-
87
-
88
-
89
-
90
-
91
-
92
-
93
-
94
-
95
-
96
-
97
-
98
-
99
-
 100
100 -
 101
101 -
 102
102 -
 103
103 -
 104
104 -
 105
105 -
 106
106 -
 107
107 -
 108
108 -
 109
109 -
 110
110 -
 111
111 -
 112
112 -
 113
113 -
 114
114 -
 115
115 -
 116
116 -
 117
117 -
 118
118 -
 119
119 -
 120
120 -
121
-
122
-
123
-
124
-
125
-
126
-
127
-
128
-
129
-
130
-
131
-
132
-
133
-
134
-
135
-
136
-
137
-
138
-
139
-
140
-
141
-
142
-
143
-
144
-
145
-
146
-
147
-
148
-
149
-
150
-
151
-
152
-
153
-
154
-
155
-
156
-
157
-
158
-
159
-
160
-
161
-
162
-
163
-
164
-
165
-
166
-
167
-
168
-
169
-
170
-
171
-
172
-
173
-
174
-
175
-
176
-
177
-
178
-
179
-
180
-
181
-
182
-
183
-
184
-
185
-
186
-
187
-
188
-
189
-
190
-
191
-
192
-
193
-
194
-
195
-
196
-
197
-
198
-
199
-
200
-
201
-
202
-
203
-
204
-
205
-
206
-
207
-
208
-
209
-
210
-
211
-
212
-
213
-
214
-
215
-
216
-
217
-
218
-
219
-
220
-
221
-
222
-
223
-
224
-
225
 |
 |

Table of Contents
BURGER KING HOLDINGS, INC. AND SUBSIDIARIES
Notes to Consolidated Financial Statements — (Continued)
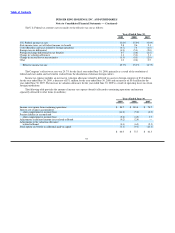
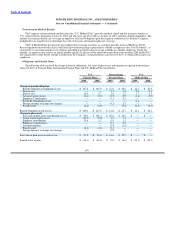
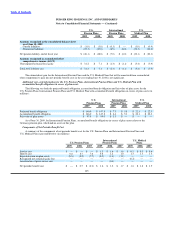
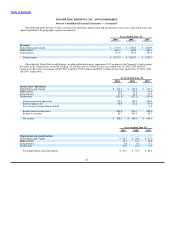
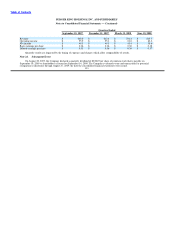
Plan Assets
The fair value of plan assets for U.S. Pension Plan as of June 30, 2009 and 2008 was $97.9 million and $99.0 million,
respectively. The fair value of plan assets for the International Pension Plans as of June 30, 2009 and 2008 was $16.6 million and
$19.7 million, respectively.
The following table sets forth the asset allocation for U.S. and International Pension Plans’ assets at the measurement date:
U.S. International
Pension Plans Pension Plans
2009 2008 2009 2008
Equity securities 48% 70% 65% 71%
Debt securities 52% 30% 35% 29%
100% 100% 100% 100%
The investment objective for the U.S. Pension Plans and International Pension Plans is to secure the benefit obligations to
participants while minimizing costs to the Company. The goal is to optimize the long−term return on plan assets at an average level of
risk. The portfolio of equity securities includes primarily large−capitalization companies with a mix of small−capitalization
international companies.
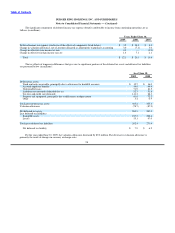
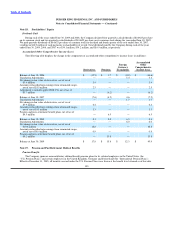
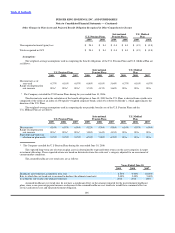
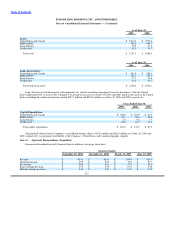
Estimated Future Cash Flows
Total contributions to the U.S. Pension Plans and International Pension Plans were $25.7 million, $6.1 million and $3.5 million for
the years ended June 30, 2009, 2008 and 2007, respectively.
The U.S. and International Pension Plans’ and U.S. Medical Plan’s expected contributions to be paid in the next fiscal year, the
projected benefit payments for each of the next five fiscal years and the total aggregate amount for the subsequent five fiscal years are
as follows:
U.S. International U.S.
Pension Plans Pension Plans Medical Plan*
Estimated Net Contributions During Fiscal 2010: $ 4.9 $ 0.4 $ 1.0
Estimated Future Year Benefit Payments During Years Ended June 30,:
2010 $ 5.8 $ 0.2 $ 1.0
2011 $ 5.9 $ 0.2 $ 1.2
2012 $ 6.2 $ 0.2 $ 1.3
2013 $ 6.5 $ 0.2 $ 1.5
2014 $ 6.9 $ 0.3 $ 1.6
2015 − 2019 $ 44.3 $ 2.2 $ 9.7
* Net of Part D Subsidy
107