Burger King 2009 Annual Report Download - page 115
Download and view the complete annual report
Please find page 115 of the 2009 Burger King annual report below. You can navigate through the pages in the report by either clicking on the pages listed below, or by using the keyword search tool below to find specific information within the annual report.-
 1
1 -
2
-
3
-
4
-
5
-
6
-
7
-
8
-
9
-
10
-
11
-
12
-
13
-
14
-
15
-
16
-
17
-
18
-
19
-
20
-
21
-
22
-
23
-
24
-
25
-
26
-
27
-
28
-
29
-
30
-
31
-
32
-
33
-
34
-
35
-
36
-
37
-
38
-
39
-
40
-
41
-
42
-
43
-
44
-
45
-
46
-
47
-
48
-
49
-
50
-
51
-
52
-
53
-
54
-
55
-
56
-
57
-
58
-
59
-
60
-
61
-
62
-
63
-
64
-
65
-
66
-
67
-
68
-
69
-
70
-
71
-
72
-
73
-
74
-
75
-
76
-
77
-
78
-
79
-
80
-
81
-
82
-
83
-
84
-
85
-
86
-
87
-
88
-
89
-
90
-
91
-
92
-
93
-
94
-
95
-
96
-
97
-
98
-
99
-
100
-
101
-
102
-
103
-
104
-
 105
105 -
 106
106 -
 107
107 -
 108
108 -
 109
109 -
 110
110 -
 111
111 -
 112
112 -
 113
113 -
 114
114 -
 115
115 -
 116
116 -
 117
117 -
 118
118 -
 119
119 -
 120
120 -
 121
121 -
 122
122 -
 123
123 -
 124
124 -
 125
125 -
126
-
127
-
128
-
129
-
130
-
131
-
132
-
133
-
134
-
135
-
136
-
137
-
138
-
139
-
140
-
141
-
142
-
143
-
144
-
145
-
146
-
147
-
148
-
149
-
150
-
151
-
152
-
153
-
154
-
155
-
156
-
157
-
158
-
159
-
160
-
161
-
162
-
163
-
164
-
165
-
166
-
167
-
168
-
169
-
170
-
171
-
172
-
173
-
174
-
175
-
176
-
177
-
178
-
179
-
180
-
181
-
182
-
183
-
184
-
185
-
186
-
187
-
188
-
189
-
190
-
191
-
192
-
193
-
194
-
195
-
196
-
197
-
198
-
199
-
200
-
201
-
202
-
203
-
204
-
205
-
206
-
207
-
208
-
209
-
210
-
211
-
212
-
213
-
214
-
215
-
216
-
217
-
218
-
219
-
220
-
221
-
222
-
223
-
224
-
225
 |
 |

Table of Contents
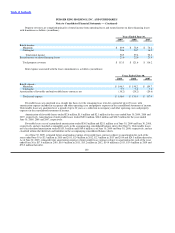
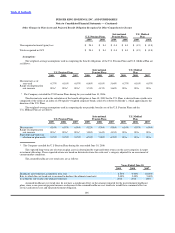
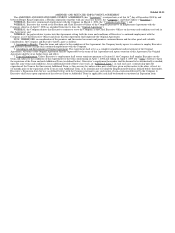
BURGER KING HOLDINGS, INC. AND SUBSIDIARIES
Notes to Consolidated Financial Statements — (Continued)
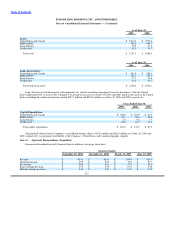
As of June 30,
2009 2008
Assets:
United States and Canada $ 2,004.3 $ 1,925.6
EMEA/APAC 598.2 660.1
Latin America 59.5 67.1
Unallocated 45.1 33.7
Total assets $ 2,707.1 $ 2,686.5
As of June 30,
2009 2008
Long−Lived Assets:
United States and Canada $ 945.0 $ 886.3
EMEA/APAC 121.3 131.3
Latin America 37.1 44.8
Unallocated 45.1 33.7
Total long−lived assets $ 1,148.5 $ 1,096.1
Long−lived assets include property and equipment, net, and net investment in property leased to franchisees. Only the United
States represented 10% or more of the Company’s total long−lived assets as of June 30, 2009 and 2008. Long−lived assets in the United
States, including the unallocated portion, totaled $917.1 million and $841.8 million as of June 30, 2009 and 2008, respectively.
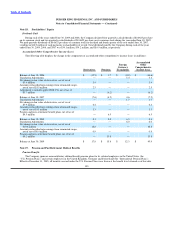
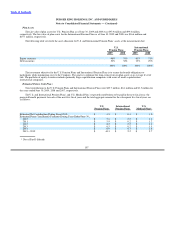
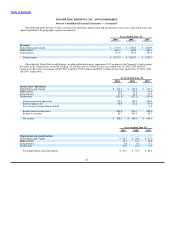
Years Ended June 30,
2009 2008 2007
Capital Expenditures:
United States and Canada $ 146.9 $ 121.9 $ 41.4
EMEA/APAC 30.7 28.6 24.8
Latin America 7.6 9.4 7.7
Unallocated 18.8 18.3 13.4
Total capital expenditures $ 204.0 $ 178.2 $ 87.3
The goodwill reflected in the Company’s consolidated balance sheets of $26.4 million and $26.6 million as of June 30, 2009 and
2008, respectively, was primarily attributable to the Company’s United States and Canada geographic segment.
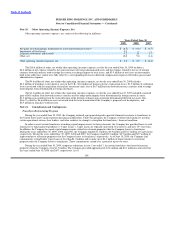
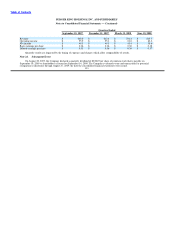
Note 23. Quarterly Financial Data (Unaudited)
Summarized unaudited quarterly financial data (in millions, except per share data):
Quarters Ended
September 30, 2008 December 31, 2008 March 31, 2009 June 30, 2009
Revenue $ 673.5 $ 634.1 $ 599.9 $ 629.9
Operating income $ 89.9 $ 86.2 $ 75.6 $ 87.7
Net income $ 49.8 $ 44.3 $ 47.1 $ 58.9
Basic earnings per share $ 0.37 $ 0.33 $ 0.35 $ 0.44
Diluted earnings per share $ 0.36 $ 0.33 $ 0.34 $ 0.43
112