Burger King 2009 Annual Report Download - page 76
Download and view the complete annual report
Please find page 76 of the 2009 Burger King annual report below. You can navigate through the pages in the report by either clicking on the pages listed below, or by using the keyword search tool below to find specific information within the annual report.-
 1
1 -
2
-
3
-
4
-
5
-
6
-
7
-
8
-
9
-
10
-
11
-
12
-
13
-
14
-
15
-
16
-
17
-
18
-
19
-
20
-
21
-
22
-
23
-
24
-
25
-
26
-
27
-
28
-
29
-
30
-
31
-
32
-
33
-
34
-
35
-
36
-
37
-
38
-
39
-
40
-
41
-
42
-
43
-
44
-
45
-
46
-
47
-
48
-
49
-
50
-
51
-
52
-
53
-
54
-
55
-
56
-
57
-
58
-
59
-
60
-
61
-
62
-
63
-
64
-
65
-
 66
66 -
 67
67 -
 68
68 -
 69
69 -
 70
70 -
 71
71 -
 72
72 -
 73
73 -
 74
74 -
 75
75 -
 76
76 -
 77
77 -
 78
78 -
 79
79 -
 80
80 -
 81
81 -
 82
82 -
 83
83 -
 84
84 -
 85
85 -
 86
86 -
87
-
88
-
89
-
90
-
91
-
92
-
93
-
94
-
95
-
96
-
97
-
98
-
99
-
100
-
101
-
102
-
103
-
104
-
105
-
106
-
107
-
108
-
109
-
110
-
111
-
112
-
113
-
114
-
115
-
116
-
117
-
118
-
119
-
120
-
121
-
122
-
123
-
124
-
125
-
126
-
127
-
128
-
129
-
130
-
131
-
132
-
133
-
134
-
135
-
136
-
137
-
138
-
139
-
140
-
141
-
142
-
143
-
144
-
145
-
146
-
147
-
148
-
149
-
150
-
151
-
152
-
153
-
154
-
155
-
156
-
157
-
158
-
159
-
160
-
161
-
162
-
163
-
164
-
165
-
166
-
167
-
168
-
169
-
170
-
171
-
172
-
173
-
174
-
175
-
176
-
177
-
178
-
179
-
180
-
181
-
182
-
183
-
184
-
185
-
186
-
187
-
188
-
189
-
190
-
191
-
192
-
193
-
194
-
195
-
196
-
197
-
198
-
199
-
200
-
201
-
202
-
203
-
204
-
205
-
206
-
207
-
208
-
209
-
210
-
211
-
212
-
213
-
214
-
215
-
216
-
217
-
218
-
219
-
220
-
221
-
222
-
223
-
224
-
225
 |
 |

Table of Contents
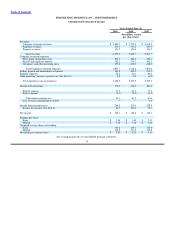
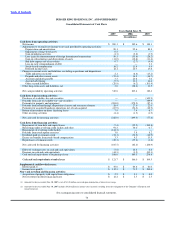
BURGER KING HOLDINGS, INC. AND SUBSIDIARIES
Consolidated Statements of Income
Years Ended June 30,
2009 2008 2007
(In millions, except
per share data)
Revenues:
Company restaurant revenues $ 1,880.5 $ 1,795.9 $ 1,658.0
Franchise revenues 543.4 537.2 459.5
Property revenues 113.5 121.6 116.2
Total revenues 2,537.4 2,454.7 2,233.7
Company restaurant expenses:
Food, paper and product costs 603.7 564.3 499.3
Payroll and employee benefits 582.2 534.7 492.1
Occupancy and other operating costs 457.8 439.0 418.0
Total Company restaurant expenses 1,643.7 1,538.0 1,409.4
Selling, general and administrative expenses 490.4 499.5 473.5
Property expenses 58.1 62.1 60.6
Other operating (income) expenses, net (See Note 2) 5.8 0.9 (4.4)
Total operating costs and expenses 2,198.0 2,100.5 1,939.1
Income from operations 339.4 354.2 294.6
Interest expense 57.3 67.1 73.1
Interest income (2.7) (5.9) (6.1)
Total interest expense, net 54.6 61.2 67.0
Loss on early extinguishment of debt — — 0.8
Income before income taxes 284.8 293.0 226.8
Income tax expense (See Note 2) 84.7 103.4 78.7
Net income $ 200.1 $ 189.6 $ 148.1
Earnings per share:
Basic $ 1.48 $ 1.40 $ 1.11
Diluted $ 1.46 $ 1.38 $ 1.08
Weighted average shares outstanding:
Basic 134.8 135.1 133.9
Diluted 136.8 137.6 136.8
Dividends per common share $ 0.25 $ 0.25 $ 0.13
See accompanying notes to consolidated financial statements.
74