Burger King 2009 Annual Report Download - page 93
Download and view the complete annual report
Please find page 93 of the 2009 Burger King annual report below. You can navigate through the pages in the report by either clicking on the pages listed below, or by using the keyword search tool below to find specific information within the annual report.-
 1
1 -
2
-
3
-
4
-
5
-
6
-
7
-
8
-
9
-
10
-
11
-
12
-
13
-
14
-
15
-
16
-
17
-
18
-
19
-
20
-
21
-
22
-
23
-
24
-
25
-
26
-
27
-
28
-
29
-
30
-
31
-
32
-
33
-
34
-
35
-
36
-
37
-
38
-
39
-
40
-
41
-
42
-
43
-
44
-
45
-
46
-
47
-
48
-
49
-
50
-
51
-
52
-
53
-
54
-
55
-
56
-
57
-
58
-
59
-
60
-
61
-
62
-
63
-
64
-
65
-
66
-
67
-
68
-
69
-
70
-
71
-
72
-
73
-
74
-
75
-
76
-
77
-
78
-
79
-
80
-
81
-
82
-
 83
83 -
 84
84 -
 85
85 -
 86
86 -
 87
87 -
 88
88 -
 89
89 -
 90
90 -
 91
91 -
 92
92 -
 93
93 -
 94
94 -
 95
95 -
 96
96 -
 97
97 -
 98
98 -
 99
99 -
 100
100 -
 101
101 -
 102
102 -
 103
103 -
104
-
105
-
106
-
107
-
108
-
109
-
110
-
111
-
112
-
113
-
114
-
115
-
116
-
117
-
118
-
119
-
120
-
121
-
122
-
123
-
124
-
125
-
126
-
127
-
128
-
129
-
130
-
131
-
132
-
133
-
134
-
135
-
136
-
137
-
138
-
139
-
140
-
141
-
142
-
143
-
144
-
145
-
146
-
147
-
148
-
149
-
150
-
151
-
152
-
153
-
154
-
155
-
156
-
157
-
158
-
159
-
160
-
161
-
162
-
163
-
164
-
165
-
166
-
167
-
168
-
169
-
170
-
171
-
172
-
173
-
174
-
175
-
176
-
177
-
178
-
179
-
180
-
181
-
182
-
183
-
184
-
185
-
186
-
187
-
188
-
189
-
190
-
191
-
192
-
193
-
194
-
195
-
196
-
197
-
198
-
199
-
200
-
201
-
202
-
203
-
204
-
205
-
206
-
207
-
208
-
209
-
210
-
211
-
212
-
213
-
214
-
215
-
216
-
217
-
218
-
219
-
220
-
221
-
222
-
223
-
224
-
225
 |
 |

Table of Contents
BURGER KING HOLDINGS, INC. AND SUBSIDIARIES
Notes to Consolidated Financial Statements — (Continued)
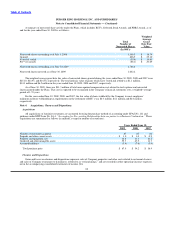
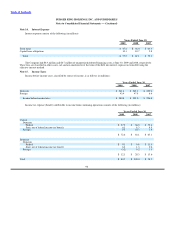
and 2008 and prepaids of $31.3 million and $37.7 million as of June 30, 2009 and 2008, respectively. Refundable income taxes for
fiscal 2009 were primarily generated as a result of tax benefits realized from the dissolution of dormant foreign entities.
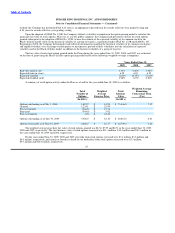
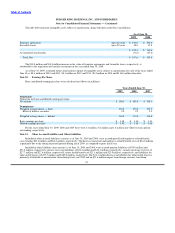
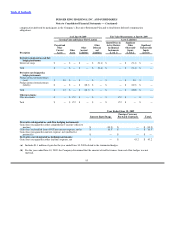
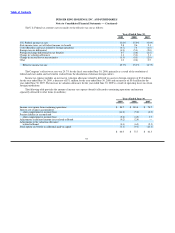
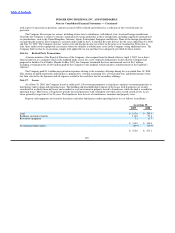
Note 8. Property and Equipment, Net
Property and equipment, net, along with their estimated useful lives, consist of the following (in millions):
As of June 30,
2009 2008
Land $ 390.3 $ 388.5
Buildings and improvements(1) (up to 40 years) 697.1 634.2
Machinery and equipment(2) (up to 18 years) 293.8 279.4
Furniture, fixtures, and other (up to 10 years) 132.8 122.1
Construction in progress 106.6 85.7
$ 1,620.6 $ 1,509.9
Accumulated depreciation and amortization(3) (607.4) (549.2)
Property and equipment, net $ 1,013.2 $ 960.7
(1) Buildings and improvements include assets under capital leases of $75.6 million and $79.4 million as of June 30, 2009 and 2008,
respectively.
(2) Machinery and equipment include assets under capital leases of $1.8 million and $3.6 million as of June 30, 2009 and 2008,
respectively.
(3) Accumulated depreciation related to capital leases totaled $34.1 million and $33.4 million as of June 30, 2009 and 2008,
respectively.
Depreciation and amortization expense on property and equipment totaled $110.1 million, $116.6 million and $110.6 million for
the years ended June 30, 2009, 2008 and 2007, respectively.
Construction in progress represents new restaurant construction, reimaging (demolish and rebuild) and remodeling of existing and
acquired restaurants.
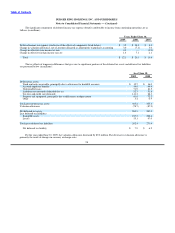
Note 9. Intangible Assets, Net and Goodwill
The Burger King Brand, which had a carrying value of $905.1 million and $934.8 million as of June 30, 2009 and 2008,
respectively, is the Company’s only intangible asset with an indefinite life. The decrease in the net carrying value of the Brand is
primarily attributable to a $29.7 million impact from foreign currency translation on the value of the Brand recorded in the Company’s
EMEA/APAC reporting segment. Goodwill had a carrying value of $26.4 million and $26.6 million as of June 30, 2009 and 2008,
respectively.
90