Burger King 2009 Annual Report Download - page 70
Download and view the complete annual report
Please find page 70 of the 2009 Burger King annual report below. You can navigate through the pages in the report by either clicking on the pages listed below, or by using the keyword search tool below to find specific information within the annual report.-
 1
1 -
2
-
3
-
4
-
5
-
6
-
7
-
8
-
9
-
10
-
11
-
12
-
13
-
14
-
15
-
16
-
17
-
18
-
19
-
20
-
21
-
22
-
23
-
24
-
25
-
26
-
27
-
28
-
29
-
30
-
31
-
32
-
33
-
34
-
35
-
36
-
37
-
38
-
39
-
40
-
41
-
42
-
43
-
44
-
45
-
46
-
47
-
48
-
49
-
50
-
51
-
52
-
53
-
54
-
55
-
56
-
57
-
58
-
59
-
 60
60 -
 61
61 -
 62
62 -
 63
63 -
 64
64 -
 65
65 -
 66
66 -
 67
67 -
 68
68 -
 69
69 -
 70
70 -
 71
71 -
 72
72 -
 73
73 -
 74
74 -
 75
75 -
 76
76 -
 77
77 -
 78
78 -
 79
79 -
 80
80 -
81
-
82
-
83
-
84
-
85
-
86
-
87
-
88
-
89
-
90
-
91
-
92
-
93
-
94
-
95
-
96
-
97
-
98
-
99
-
100
-
101
-
102
-
103
-
104
-
105
-
106
-
107
-
108
-
109
-
110
-
111
-
112
-
113
-
114
-
115
-
116
-
117
-
118
-
119
-
120
-
121
-
122
-
123
-
124
-
125
-
126
-
127
-
128
-
129
-
130
-
131
-
132
-
133
-
134
-
135
-
136
-
137
-
138
-
139
-
140
-
141
-
142
-
143
-
144
-
145
-
146
-
147
-
148
-
149
-
150
-
151
-
152
-
153
-
154
-
155
-
156
-
157
-
158
-
159
-
160
-
161
-
162
-
163
-
164
-
165
-
166
-
167
-
168
-
169
-
170
-
171
-
172
-
173
-
174
-
175
-
176
-
177
-
178
-
179
-
180
-
181
-
182
-
183
-
184
-
185
-
186
-
187
-
188
-
189
-
190
-
191
-
192
-
193
-
194
-
195
-
196
-
197
-
198
-
199
-
200
-
201
-
202
-
203
-
204
-
205
-
206
-
207
-
208
-
209
-
210
-
211
-
212
-
213
-
214
-
215
-
216
-
217
-
218
-
219
-
220
-
221
-
222
-
223
-
224
-
225
 |
 |

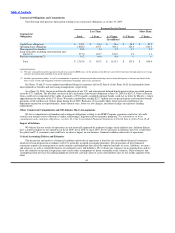
Table of Contents
do, however, largely offset the impact of changes in the value of the underlying risk that they are intended to economically hedge,
which is also reflected in our condensed consolidated statements of income (See Note 13 to the Consolidated Financial Statements). As
of June 30, 2009, we had forward contracts to hedge the net U.S. dollar equivalent of $397.0 million of foreign currency−denominated
assets. This U.S. dollar equivalent by currency is as follows: $302.6 million in Euros; $72.3 million in British Pounds, $17.4 million in
Canadian Dollars and $4.7 million in Australian Dollars. All foreign currency forward contracts expire prior to June 2010.
We are exposed to losses in the event of nonperformance by counterparties on these forward contracts. We attempt to minimize
this risk by selecting counterparties with investment grade credit ratings, limiting our exposure to any single counterparty and regularly
monitoring our market position with each counterparty.
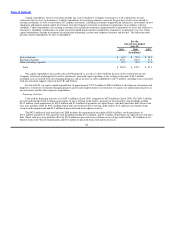
Interest Rate Risk
We have a market risk exposure to changes in interest rates, principally in the United States. We attempt to minimize this risk and
lower our overall borrowing costs through the utilization of interest rate swaps. These swaps are entered into with financial institutions
and have reset dates and key terms that match those of the underlying debt. Accordingly, any change in market value associated with
interest rate swaps is offset by the opposite market impact on the related debt.
As of June 30, 2009, we had interest rate swaps with a notional value of $595.0 million that qualify as cash flow hedges. These
interest rate swaps help us manage exposure to changes in forecasted LIBOR−based interest payments made on variable−rate debt. A
1% change in interest rates on our existing debt of $816.2 million would have resulted in an increase or decrease in interest expense of
approximately $2.2 million for fiscal year 2009.
Commodity Price Risk
We purchase certain products, including beef, chicken, cheese, french fries, tomatoes and other commodities which are subject to
price volatility that is caused by weather, market conditions and other factors that are not considered predictable or within our control.
Additionally, our ability to recover increased costs is typically limited by the competitive environment in which we operate. We do not
utilize commodity option or future contracts to hedge commodity prices and do not have long−term pricing arrangements other than for
chicken, which expires in December 2009 and natural gas contracts which expire at various dates during fiscal 2010. As a result, we
purchase beef and other commodities at market prices, which fluctuate on a daily basis.
The estimated change in Company restaurant food, paper and product costs from a hypothetical 10% change in average prices of
our commodities would have been approximately $58.4 million for fiscal 2009. The hypothetical change in food, paper and product
costs could be positively or negatively affected by changes in prices or product sales mix.
68