Burger King 2009 Annual Report Download - page 75
Download and view the complete annual report
Please find page 75 of the 2009 Burger King annual report below. You can navigate through the pages in the report by either clicking on the pages listed below, or by using the keyword search tool below to find specific information within the annual report.-
 1
1 -
2
-
3
-
4
-
5
-
6
-
7
-
8
-
9
-
10
-
11
-
12
-
13
-
14
-
15
-
16
-
17
-
18
-
19
-
20
-
21
-
22
-
23
-
24
-
25
-
26
-
27
-
28
-
29
-
30
-
31
-
32
-
33
-
34
-
35
-
36
-
37
-
38
-
39
-
40
-
41
-
42
-
43
-
44
-
45
-
46
-
47
-
48
-
49
-
50
-
51
-
52
-
53
-
54
-
55
-
56
-
57
-
58
-
59
-
60
-
61
-
62
-
63
-
64
-
 65
65 -
 66
66 -
 67
67 -
 68
68 -
 69
69 -
 70
70 -
 71
71 -
 72
72 -
 73
73 -
 74
74 -
 75
75 -
 76
76 -
 77
77 -
 78
78 -
 79
79 -
 80
80 -
 81
81 -
 82
82 -
 83
83 -
 84
84 -
 85
85 -
86
-
87
-
88
-
89
-
90
-
91
-
92
-
93
-
94
-
95
-
96
-
97
-
98
-
99
-
100
-
101
-
102
-
103
-
104
-
105
-
106
-
107
-
108
-
109
-
110
-
111
-
112
-
113
-
114
-
115
-
116
-
117
-
118
-
119
-
120
-
121
-
122
-
123
-
124
-
125
-
126
-
127
-
128
-
129
-
130
-
131
-
132
-
133
-
134
-
135
-
136
-
137
-
138
-
139
-
140
-
141
-
142
-
143
-
144
-
145
-
146
-
147
-
148
-
149
-
150
-
151
-
152
-
153
-
154
-
155
-
156
-
157
-
158
-
159
-
160
-
161
-
162
-
163
-
164
-
165
-
166
-
167
-
168
-
169
-
170
-
171
-
172
-
173
-
174
-
175
-
176
-
177
-
178
-
179
-
180
-
181
-
182
-
183
-
184
-
185
-
186
-
187
-
188
-
189
-
190
-
191
-
192
-
193
-
194
-
195
-
196
-
197
-
198
-
199
-
200
-
201
-
202
-
203
-
204
-
205
-
206
-
207
-
208
-
209
-
210
-
211
-
212
-
213
-
214
-
215
-
216
-
217
-
218
-
219
-
220
-
221
-
222
-
223
-
224
-
225
 |
 |

Table of Contents
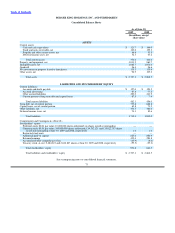
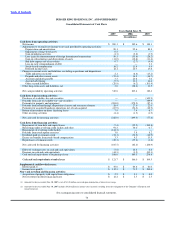
BURGER KING HOLDINGS, INC. AND SUBSIDIARIES
Consolidated Balance Sheets
As of June 30,
2009 2008
(In millions, except
share data)
ASSETS
Current assets:
Cash and cash equivalents $ 121.7 $ 166.0
Trade and notes receivable, net 130.0 139.3
Prepaids and other current assets, net 86.4 53.5
Deferred income taxes, net 32.5 45.2
Total current assets 370.6 404.0
Property and equipment, net 1,013.2 960.7
Intangible assets, net 1,062.7 1,054.6
Goodwill 26.4 26.6
Net investment in property leased to franchisees 135.3 135.4
Other assets, net 98.9 105.2
Total assets $ 2,707.1 $ 2,686.5
LIABILITIES AND STOCKHOLDERS’ EQUITY
Current liabilities:
Accounts and drafts payable $ 127.0 $ 129.5
Accrued advertising 67.8 77.2
Other accrued liabilities 220.0 241.9
Current portion of long term debt and capital leases 67.5 7.4
Total current liabilities 482.3 456.0
Term debt, net of current portion 755.6 868.8
Capital leases, net of current portion 65.8 71.2
Other liabilities, net 354.5 360.4
Deferred income taxes, net 74.1 85.6
Total liabilities 1,732.3 1,842.0
Commitments and Contingencies (Note 21)
Stockholders’ equity:
Preferred stock, $0.01 par value; 10,000,000 shares authorized; no shares issued or outstanding — —
Common stock, $0.01 par value; 300,000,000 shares authorized; 134,792,121 and 135,022,753 shares
issued and outstanding at June 30, 2009 and 2008, respectively 1.4 1.4
Restricted stock units — —
Additional paid−in capital 623.4 600.9
Retained earnings 455.4 289.8
Accumulated other comprehensive loss (45.9) (8.4)
Treasury stock, at cost; 2,884,223 and 2,042,887 shares at June 30, 2009 and 2008, respectively (59.5) (39.2)
Total stockholders’ equity 974.8 844.5
Total liabilities and stockholders’ equity $ 2,707.1 $ 2,686.5
See accompanying notes to consolidated financial statements.
73