Burger King 2009 Annual Report Download - page 54
Download and view the complete annual report
Please find page 54 of the 2009 Burger King annual report below. You can navigate through the pages in the report by either clicking on the pages listed below, or by using the keyword search tool below to find specific information within the annual report.-
 1
1 -
2
-
3
-
4
-
5
-
6
-
7
-
8
-
9
-
10
-
11
-
12
-
13
-
14
-
15
-
16
-
17
-
18
-
19
-
20
-
21
-
22
-
23
-
24
-
25
-
26
-
27
-
28
-
29
-
30
-
31
-
32
-
33
-
34
-
35
-
36
-
37
-
38
-
39
-
40
-
41
-
42
-
43
-
 44
44 -
 45
45 -
 46
46 -
 47
47 -
 48
48 -
 49
49 -
 50
50 -
 51
51 -
 52
52 -
 53
53 -
 54
54 -
 55
55 -
 56
56 -
 57
57 -
 58
58 -
 59
59 -
 60
60 -
 61
61 -
 62
62 -
 63
63 -
 64
64 -
65
-
66
-
67
-
68
-
69
-
70
-
71
-
72
-
73
-
74
-
75
-
76
-
77
-
78
-
79
-
80
-
81
-
82
-
83
-
84
-
85
-
86
-
87
-
88
-
89
-
90
-
91
-
92
-
93
-
94
-
95
-
96
-
97
-
98
-
99
-
100
-
101
-
102
-
103
-
104
-
105
-
106
-
107
-
108
-
109
-
110
-
111
-
112
-
113
-
114
-
115
-
116
-
117
-
118
-
119
-
120
-
121
-
122
-
123
-
124
-
125
-
126
-
127
-
128
-
129
-
130
-
131
-
132
-
133
-
134
-
135
-
136
-
137
-
138
-
139
-
140
-
141
-
142
-
143
-
144
-
145
-
146
-
147
-
148
-
149
-
150
-
151
-
152
-
153
-
154
-
155
-
156
-
157
-
158
-
159
-
160
-
161
-
162
-
163
-
164
-
165
-
166
-
167
-
168
-
169
-
170
-
171
-
172
-
173
-
174
-
175
-
176
-
177
-
178
-
179
-
180
-
181
-
182
-
183
-
184
-
185
-
186
-
187
-
188
-
189
-
190
-
191
-
192
-
193
-
194
-
195
-
196
-
197
-
198
-
199
-
200
-
201
-
202
-
203
-
204
-
205
-
206
-
207
-
208
-
209
-
210
-
211
-
212
-
213
-
214
-
215
-
216
-
217
-
218
-
219
-
220
-
221
-
222
-
223
-
224
-
225
 |
 |

Table of Contents
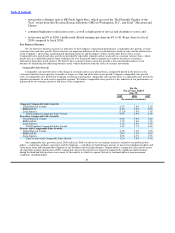
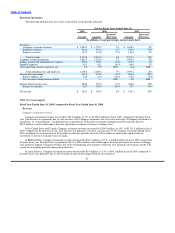
a percentage of Company restaurant revenues, food, paper and product costs increased by 0.7% to 32.1%, primarily due to the increase
in commodity costs noted above, partially offset by the impact of strategic pricing initiatives.
In the United States and Canada, food, paper and product costs increased by $58.8 million, or 15%, to $440.0 million in fiscal
2009, primarily as a result of the net addition of 59 Company restaurants during fiscal 2009, as well as significant increases in
commodity costs, including the negative currency exchange impact of cross border purchases in Canada, partially offset by a
$7.4 million favorable impact from the movement of currency exchange rates. Food, paper and product costs as a percentage of
Company restaurant revenues increased 0.5% to 33.0%, primarily due to an increase in the cost of beef, cheese, chicken and other food
costs, including the currency exchange impact of cross border purchases in Canada, partially offset by the impact of strategic pricing
initiatives.
The cost of many of our core commodities reached historical highs in the United States and Canada during the first quarter of
fiscal 2009; however, commodity and other food costs moderated throughout the remainder of fiscal 2009.
In EMEA/APAC, food, paper and product costs decreased by $17.6 million, or 11%, to $140.6 million for fiscal 2009, primarily
as a result of the favorable impact from the movement of currency exchange rates of $14.7 million and the refranchising of Company
restaurants in the prior year, primarily in Germany and the U.K., partially offset by an increase in commodity costs, including the
negative currency exchange impact of cross border purchases. Food, paper and product costs as a percentage of Company restaurant
revenues increased 0.3% to 28.8%, primarily due to a significant increase in commodity costs, partially offset by the impact of strategic
pricing initiatives.
In Latin America, food, paper and product costs decreased by $1.8 million, or 7%, to $23.1 million for fiscal 2009, compared to
the same period in the prior year, as a result of the benefits derived from the favorable impact from the movement of currency exchange
rates of $4.0 million, offset by the net addition of eight Company restaurants during fiscal 2009 and an increase in commodity costs,
including the negative currency exchange impact of cross border purchases in Mexico and the indexing of local purchases to the
U.S. dollar. Food, paper and product costs as a percentage of Company restaurant revenues increased by 1.7% to 38.4% primarily due
to the increase in commodity costs as noted above, partially offset by the impact of strategic pricing initiatives.
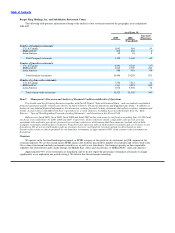
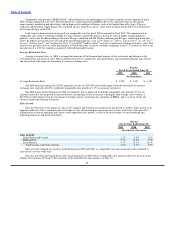
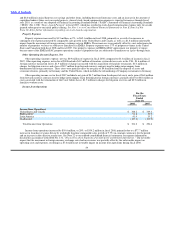
Payroll and employee benefits costs
Total payroll and employee benefits costs increased by $47.5 million, or 9%, to $582.2 million in fiscal 2009, primarily due to the
net addition of 69 Company restaurants during fiscal 2009, as well as increased labor costs in the United States and Canada and EMEA,
partially offset by a $24.0 million favorable impact from the movement of currency exchange rates. As a percentage of Company
restaurant revenues, payroll and employee benefits costs increased by 1.2% to 31.0%, primarily as a result of increased labor costs in
EMEA and the United States and Canada, partially offset by positive worldwide Company comparable sales growth of 0.3% (in
constant currencies).
In the United States and Canada, payroll and employee benefits costs increased by $58.2 million, or 16%, to $414.9 million in
fiscal 2009, primarily as a result of the net addition of 59 Company restaurants during fiscal 2009 and increased labor costs resulting
from the negative impact from decreased traffic and increased staffing and training on acquired restaurants, partially offset by a
$6.8 million favorable impact from the movement of currency exchange rates in Canada. As a percentage of Company restaurant
revenues, payroll and employee benefits costs increased by 0.6% to 31.1%, primarily due to labor inefficiencies noted above, partially
offset by benefits derived from positive Company comparable sales growth of 0.5% (in constant currencies).
In EMEA/APAC, payroll and employee benefits costs decreased by $9.8 million, or 6% to $159.9 million in fiscal 2009, primarily
as a result of a $16.0 million favorable impact from the movement of currency exchange rates and the refranchising of Company
restaurants in the prior year, primarily in Germany and the U.K., partially offset by government mandated and contractual wage and
benefits increases in Germany. As a percentage of Company restaurant revenues, payroll and employee benefits costs increased by
2.2% to 32.7%, primarily as a result of increases in labor costs in Germany.
In Latin America, payroll and employee benefits costs decreased by $0.9 million, or 11% to $7.4 million in fiscal 2009, compared
to the same period in the prior fiscal year as a result of a $1.2 million favorable impact from
52