Burger King 2009 Annual Report Download - page 13
Download and view the complete annual report
Please find page 13 of the 2009 Burger King annual report below. You can navigate through the pages in the report by either clicking on the pages listed below, or by using the keyword search tool below to find specific information within the annual report.-
 1
1 -
2
-
 3
3 -
 4
4 -
 5
5 -
 6
6 -
 7
7 -
 8
8 -
 9
9 -
 10
10 -
 11
11 -
 12
12 -
 13
13 -
 14
14 -
 15
15 -
 16
16 -
 17
17 -
 18
18 -
 19
19 -
 20
20 -
 21
21 -
 22
22 -
 23
23 -
24
-
25
-
26
-
27
-
28
-
29
-
30
-
31
-
32
-
33
-
34
-
35
-
36
-
37
-
38
-
39
-
40
-
41
-
42
-
43
-
44
-
45
-
46
-
47
-
48
-
49
-
50
-
51
-
52
-
53
-
54
-
55
-
56
-
57
-
58
-
59
-
60
-
61
-
62
-
63
-
64
-
65
-
66
-
67
-
68
-
69
-
70
-
71
-
72
-
73
-
74
-
75
-
76
-
77
-
78
-
79
-
80
-
81
-
82
-
83
-
84
-
85
-
86
-
87
-
88
-
89
-
90
-
91
-
92
-
93
-
94
-
95
-
96
-
97
-
98
-
99
-
100
-
101
-
102
-
103
-
104
-
105
-
106
-
107
-
108
-
109
-
110
-
111
-
112
-
113
-
114
-
115
-
116
-
117
-
118
-
119
-
120
-
121
-
122
-
123
-
124
-
125
-
126
-
127
-
128
-
129
-
130
-
131
-
132
-
133
-
134
-
135
-
136
-
137
-
138
-
139
-
140
-
141
-
142
-
143
-
144
-
145
-
146
-
147
-
148
-
149
-
150
-
151
-
152
-
153
-
154
-
155
-
156
-
157
-
158
-
159
-
160
-
161
-
162
-
163
-
164
-
165
-
166
-
167
-
168
-
169
-
170
-
171
-
172
-
173
-
174
-
175
-
176
-
177
-
178
-
179
-
180
-
181
-
182
-
183
-
184
-
185
-
186
-
187
-
188
-
189
-
190
-
191
-
192
-
193
-
194
-
195
-
196
-
197
-
198
-
199
-
200
-
201
-
202
-
203
-
204
-
205
-
206
-
207
-
208
-
209
-
210
-
211
-
212
-
213
-
214
-
215
-
216
-
217
-
218
-
219
-
220
-
221
-
222
-
223
-
224
-
225
 |
 |

Table of Contents
markets, including countries in Eastern Europe, the Mediterranean and the Middle East, and we are in the process of identifying
prospective new franchisees for these markets.
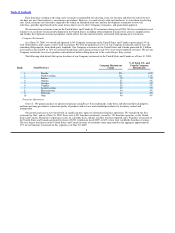
Company Restaurants
As of June 30, 2009, 278 (or 11%) of the restaurants in EMEA were Company restaurants. As of June 30, 2009, there were 16
Company restaurants in APAC, all of which were located in China. In July 2009, we opened our first Company restaurant in Singapore.
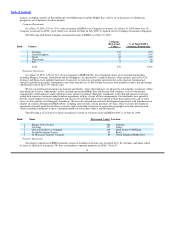
The following table details Company restaurant locations in EMEA as of June 30, 2009:
Company
Restaurant % of Total EMEA
Rank Country Count Company Restaurants
1 Germany 145 52%
2 United Kingdom 64 23%
3 Spain 45 16%
4 Netherlands 22 8%
5 Italy 2 1%
Total 278 100%
Franchise Operations
As of June 30, 2009, 3,019 or 91% of our restaurants in EMEA/APAC were franchised. Some of our international markets,
including Hungary, Portugal, South Korea and the Philippines, are operated by a single franchisee. Other markets, such as the U.K.,
Germany and Spain, have multiple franchisees. In general, we enter into a franchise agreement for each restaurant. International
franchise agreements generally contemplate a one−time franchise fee of $50,000 per restaurant, with monthly royalties and advertising
contributions each of up to 5% of gross sales.
We have granted master franchises in Australia and Turkey, where the franchisees are allowed to sub−franchise restaurants within
their particular territory. Additionally, in New Zealand and certain Middle East and Persian Gulf countries, we have entered into
arrangements with franchisees under which they have agreed to nominate third party franchisees to develop and operate restaurants
within their respective territories under franchise agreements with us. As part of these arrangements, the franchisees have agreed to
provide certain support services to third party franchisees on our behalf, and we have agreed to share the franchise fees and, in some
cases, royalties paid by such third party franchisees. We have also entered into exclusive development agreements with franchisees in a
number of countries throughout EMEA/APAC, including, most recently, certain provinces of China. These exclusive development
agreements generally grant the franchisee exclusive rights to develop restaurants in a particular geographic area and contain growth
clauses requiring franchisees to open a minimum number of restaurants within a specified period.
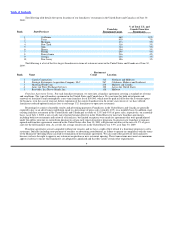
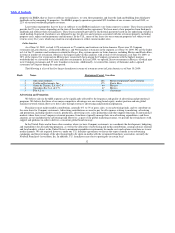
The following is a list of the five largest franchisees in terms of restaurant count in EMEA/APAC as of June 30, 2009:
Rank Name Restaurant Count Location
1 Hungry Jack’s Pty Ltd. 284 Australia
2 Tab Gida 247 Turkey
3 Olayan Food Service Company 109 Saudi Arabia /UAE/Egypt
4 System Restaurant Service 99 Korea
5 Al−Homaizi Foodstuff Company 89 United Kingdom/Middle East
Property Operations
Our property operations in EMEA primarily consist of franchise restaurant sites located in the U.K., Germany and Spain, which
we lease or sublease to franchisees. We have no franchisee−operated properties in APAC. Of the 97
11