Burger King 2009 Annual Report Download - page 58
Download and view the complete annual report
Please find page 58 of the 2009 Burger King annual report below. You can navigate through the pages in the report by either clicking on the pages listed below, or by using the keyword search tool below to find specific information within the annual report.-
 1
1 -
2
-
3
-
4
-
5
-
6
-
7
-
8
-
9
-
10
-
11
-
12
-
13
-
14
-
15
-
16
-
17
-
18
-
19
-
20
-
21
-
22
-
23
-
24
-
25
-
26
-
27
-
28
-
29
-
30
-
31
-
32
-
33
-
34
-
35
-
36
-
37
-
38
-
39
-
40
-
41
-
42
-
43
-
44
-
45
-
46
-
47
-
 48
48 -
 49
49 -
 50
50 -
 51
51 -
 52
52 -
 53
53 -
 54
54 -
 55
55 -
 56
56 -
 57
57 -
 58
58 -
 59
59 -
 60
60 -
 61
61 -
 62
62 -
 63
63 -
 64
64 -
 65
65 -
 66
66 -
 67
67 -
 68
68 -
69
-
70
-
71
-
72
-
73
-
74
-
75
-
76
-
77
-
78
-
79
-
80
-
81
-
82
-
83
-
84
-
85
-
86
-
87
-
88
-
89
-
90
-
91
-
92
-
93
-
94
-
95
-
96
-
97
-
98
-
99
-
100
-
101
-
102
-
103
-
104
-
105
-
106
-
107
-
108
-
109
-
110
-
111
-
112
-
113
-
114
-
115
-
116
-
117
-
118
-
119
-
120
-
121
-
122
-
123
-
124
-
125
-
126
-
127
-
128
-
129
-
130
-
131
-
132
-
133
-
134
-
135
-
136
-
137
-
138
-
139
-
140
-
141
-
142
-
143
-
144
-
145
-
146
-
147
-
148
-
149
-
150
-
151
-
152
-
153
-
154
-
155
-
156
-
157
-
158
-
159
-
160
-
161
-
162
-
163
-
164
-
165
-
166
-
167
-
168
-
169
-
170
-
171
-
172
-
173
-
174
-
175
-
176
-
177
-
178
-
179
-
180
-
181
-
182
-
183
-
184
-
185
-
186
-
187
-
188
-
189
-
190
-
191
-
192
-
193
-
194
-
195
-
196
-
197
-
198
-
199
-
200
-
201
-
202
-
203
-
204
-
205
-
206
-
207
-
208
-
209
-
210
-
211
-
212
-
213
-
214
-
215
-
216
-
217
-
218
-
219
-
220
-
221
-
222
-
223
-
224
-
225
 |
 |

Table of Contents
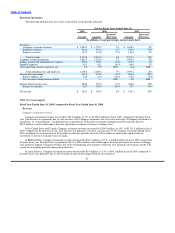
51%, of the increase in Company restaurant revenues was generated by the favorable impact from the movement of foreign currency
exchange rates, primarily in EMEA.
In the United States and Canada, Company restaurant revenues increased by $89.8 million, or 8%, to $1.2 billion in fiscal 2008,
primarily as a result of a net increase of 87 Company restaurants during fiscal 2008, including the acquisition of 56 franchise restaurants
in April 2008, and Company comparable sales growth of 2.6% (in constant currencies) for the period in this segment. Approximately
$16.4 million, or 18%, of the increase in Company restaurant revenues was generated by the favorable impact from the movement of
foreign currency exchange rates in Canada.
In EMEA/APAC, Company restaurant revenues increased by $39.7 million, or 8%, to $554.9 million in fiscal 2008, primarily as a
result of Company comparable sales growth of 3.8% (in constant currencies) for the period in this segment and a $52.6 million
favorable impact from the movement of foreign currency exchange rates. Partially offsetting these factors was a decrease in revenues
from a net decrease of 37 Company restaurants during fiscal 2008, which was primarily attributable to 15 closures and 16 refranchisings
in the U.K.
In Latin America, Company restaurant revenues increased by $8.4 million, or 14%, to $69.1 million in fiscal 2008, primarily as a
result of a net increase of seven Company restaurants during fiscal 2008, Company comparable sales growth of 1.8% (in constant
currencies) for the period in this segment and a $1.2 million favorable impact from the movement of foreign currency exchange rates.
Franchise Revenues
Total franchise revenues increased by $77.7 million, or 17%, to $537.2 million in fiscal 2008, driven by a net increase of 225
franchise restaurants during fiscal 2008, worldwide franchise comparable sales growth of 5.7% (in constant currencies) for the period
and a $16.2 million favorable impact from the movement of foreign currency exchange rates.
In the United States and Canada, franchise revenues increased by $34.3 million, or 12%, to $317.9 million in fiscal 2008,
primarily as a result of franchise comparable sales growth of 5.8% (in constant currencies) for the period in this segment and higher
effective royalty rates, partially offset by the elimination of royalties from 63 fewer franchise restaurants driven by acquisitions by the
Company and closures during fiscal 2008, including the acquisition of 56 franchise restaurants in April 2008.
In EMEA/APAC, franchise revenues increased by $37.9 million, or 28%, to $173.0 million in fiscal 2008, driven by a net increase
of 196 franchise restaurants during fiscal 2008, franchise comparable sales growth of 5.6% (in constant currencies) for the period in this
segment and a $16.2 million favorable impact from the movement of foreign currency exchange rates.
Latin America franchise revenues increased by $5.5 million, or 13%, to $46.3 million in fiscal 2008, as a result of the net addition
of 92 franchise restaurants during fiscal 2008 and franchise comparable sales growth of 4.5% (in constant currencies) for the period in
this segment.
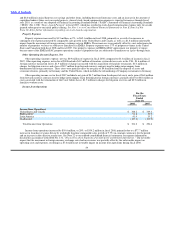
Property Revenues
Total property revenues increased by $5.4 million, or 5%, to $121.6 million in fiscal 2008, primarily as a result of worldwide
franchise comparable sales growth of 5.7% (in constant currencies) resulting in increased contingent rents and a $2.0 million favorable
impact from the movement of foreign currency exchange rates, partially offset by the net effect of changes to our property portfolio,
which includes the impact of the closure or acquisition of restaurants leased to franchisees.
In the United States and Canada, property revenues increased by $3.5 million, or 4%, to $88.7 million in fiscal 2008. This increase
was driven by increased contingent rent payments from increased franchise sales.
Our EMEA/APAC property revenues increased by $1.9 million, or 6%, to $32.9 million, primarily from increased contingent rents
as a result of an increase in franchise sales and a $1.6 million favorable impact from the movement of foreign currency exchange rates,
partially offset by the effect of a net reduction in the number of properties we lease or sublease to franchisees in EMEA.
56