Burger King 2009 Annual Report Download - page 52
Download and view the complete annual report
Please find page 52 of the 2009 Burger King annual report below. You can navigate through the pages in the report by either clicking on the pages listed below, or by using the keyword search tool below to find specific information within the annual report.-
 1
1 -
2
-
3
-
4
-
5
-
6
-
7
-
8
-
9
-
10
-
11
-
12
-
13
-
14
-
15
-
16
-
17
-
18
-
19
-
20
-
21
-
22
-
23
-
24
-
25
-
26
-
27
-
28
-
29
-
30
-
31
-
32
-
33
-
34
-
35
-
36
-
37
-
38
-
39
-
40
-
41
-
 42
42 -
 43
43 -
 44
44 -
 45
45 -
 46
46 -
 47
47 -
 48
48 -
 49
49 -
 50
50 -
 51
51 -
 52
52 -
 53
53 -
 54
54 -
 55
55 -
 56
56 -
 57
57 -
 58
58 -
 59
59 -
 60
60 -
 61
61 -
 62
62 -
63
-
64
-
65
-
66
-
67
-
68
-
69
-
70
-
71
-
72
-
73
-
74
-
75
-
76
-
77
-
78
-
79
-
80
-
81
-
82
-
83
-
84
-
85
-
86
-
87
-
88
-
89
-
90
-
91
-
92
-
93
-
94
-
95
-
96
-
97
-
98
-
99
-
100
-
101
-
102
-
103
-
104
-
105
-
106
-
107
-
108
-
109
-
110
-
111
-
112
-
113
-
114
-
115
-
116
-
117
-
118
-
119
-
120
-
121
-
122
-
123
-
124
-
125
-
126
-
127
-
128
-
129
-
130
-
131
-
132
-
133
-
134
-
135
-
136
-
137
-
138
-
139
-
140
-
141
-
142
-
143
-
144
-
145
-
146
-
147
-
148
-
149
-
150
-
151
-
152
-
153
-
154
-
155
-
156
-
157
-
158
-
159
-
160
-
161
-
162
-
163
-
164
-
165
-
166
-
167
-
168
-
169
-
170
-
171
-
172
-
173
-
174
-
175
-
176
-
177
-
178
-
179
-
180
-
181
-
182
-
183
-
184
-
185
-
186
-
187
-
188
-
189
-
190
-
191
-
192
-
193
-
194
-
195
-
196
-
197
-
198
-
199
-
200
-
201
-
202
-
203
-
204
-
205
-
206
-
207
-
208
-
209
-
210
-
211
-
212
-
213
-
214
-
215
-
216
-
217
-
218
-
219
-
220
-
221
-
222
-
223
-
224
-
225
 |
 |

Table of Contents
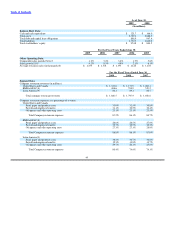
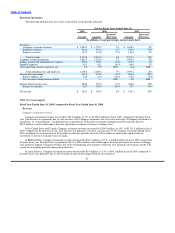
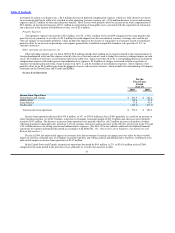
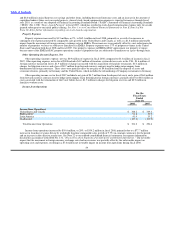
Results of Operations
The following table presents our results of operations for the periods indicated:
For the Fiscal Years Ended June 30,
2009 2008 2007
Increase/ Increase/
Amount Amount (Decrease) Amount (Decrease)
(In millions, except percentages and per share data)
Revenues:
Company restaurant revenues $ 1,880.5 $ 1,795.9 5% $ 1,658.0 8%
Franchise revenues 543.4 537.2 1% 459.5 17%
Property revenues 113.5 121.6 (7)% 116.2 5%
Total revenues 2,537.4 2,454.7 3% 2,233.7 10%
Company restaurant expenses 1,643.7 1,538.0 7% 1,409.4 9%
Selling, general and administrative expenses 490.4 499.5 (2)% 473.5 5%
Property expenses 58.1 62.1 (6)% 60.6 2%
Other operating (income) expenses, net 5.8 0.9 NM (4.4) NM
Total operating costs and expenses 2,198.0 2,100.5 5% 1,939.1 8%
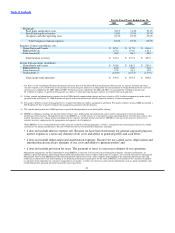
Income from operations 339.4 354.2 (4)% 294.6 20%
Interest expense, net 54.6 61.2 (11)% 67.0 (9)%
Loss on early extinguishment of debt — — NM 0.8 NM
Income before income taxes 284.8 293.0 (3)% 226.8 29%
Income tax expense 84.7 103.4 (18)% 78.7 31%
Net income $ 200.1 $ 189.6 6% $ 148.1 28%
NM Not meaningful
Fiscal Year Ended June 30, 2009 Compared to Fiscal Year Ended June 30, 2008
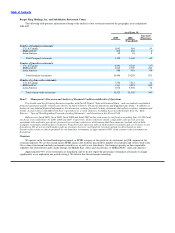
Revenues
Company restaurant revenues
Company restaurant revenues increased by $84.6 million, or 5%, to $1,880.5 million in fiscal 2009, compared to the prior fiscal
year. This increase was primarily due to a net increase of 69 Company restaurants (net of closures and sales of Company restaurants to
franchisees, or “refranchisings”), including the net acquisition of 36 franchise restaurants during fiscal 2009, partially offset by
$80.5 million of unfavorable impact from the significant movement of currency exchange rates.
In the United States and Canada, Company restaurant revenues increased by $159.9 million, or 14%, to $1,331.8 million in fiscal
2009, compared to the prior fiscal year. This increase was primarily a result of a net increase of 59 Company restaurants during fiscal
2009, including the net acquisition of 42 franchise restaurants, partially offset by $20.6 million of unfavorable impact from the
movement of currency exchange rates in Canada.
In EMEA/APAC, Company restaurant revenues decreased by $66.3 million, or 12%, to $488.6 million in fiscal 2009 compared to
the prior fiscal year. This decrease was primarily due to a $50.0 million unfavorable impact from the movement of currency exchange
rates and lost Company restaurant revenues due to the refranchising of restaurants in the prior year, primarily in Germany and the U.K.
as part of our ongoing portfolio management initiative.
In Latin America, Company restaurant revenues decreased by $9.0 million, or 13%, to $60.1 million in fiscal 2009, compared to
the prior fiscal year, primarily due to $10.0 million of unfavorable impact from the movement of
50