Burger King 2009 Annual Report Download - page 48
Download and view the complete annual report
Please find page 48 of the 2009 Burger King annual report below. You can navigate through the pages in the report by either clicking on the pages listed below, or by using the keyword search tool below to find specific information within the annual report.-
 1
1 -
2
-
3
-
4
-
5
-
6
-
7
-
8
-
9
-
10
-
11
-
12
-
13
-
14
-
15
-
16
-
17
-
18
-
19
-
20
-
21
-
22
-
23
-
24
-
25
-
26
-
27
-
28
-
29
-
30
-
31
-
32
-
33
-
34
-
35
-
36
-
37
-
 38
38 -
 39
39 -
 40
40 -
 41
41 -
 42
42 -
 43
43 -
 44
44 -
 45
45 -
 46
46 -
 47
47 -
 48
48 -
 49
49 -
 50
50 -
 51
51 -
 52
52 -
 53
53 -
 54
54 -
 55
55 -
 56
56 -
 57
57 -
 58
58 -
59
-
60
-
61
-
62
-
63
-
64
-
65
-
66
-
67
-
68
-
69
-
70
-
71
-
72
-
73
-
74
-
75
-
76
-
77
-
78
-
79
-
80
-
81
-
82
-
83
-
84
-
85
-
86
-
87
-
88
-
89
-
90
-
91
-
92
-
93
-
94
-
95
-
96
-
97
-
98
-
99
-
100
-
101
-
102
-
103
-
104
-
105
-
106
-
107
-
108
-
109
-
110
-
111
-
112
-
113
-
114
-
115
-
116
-
117
-
118
-
119
-
120
-
121
-
122
-
123
-
124
-
125
-
126
-
127
-
128
-
129
-
130
-
131
-
132
-
133
-
134
-
135
-
136
-
137
-
138
-
139
-
140
-
141
-
142
-
143
-
144
-
145
-
146
-
147
-
148
-
149
-
150
-
151
-
152
-
153
-
154
-
155
-
156
-
157
-
158
-
159
-
160
-
161
-
162
-
163
-
164
-
165
-
166
-
167
-
168
-
169
-
170
-
171
-
172
-
173
-
174
-
175
-
176
-
177
-
178
-
179
-
180
-
181
-
182
-
183
-
184
-
185
-
186
-
187
-
188
-
189
-
190
-
191
-
192
-
193
-
194
-
195
-
196
-
197
-
198
-
199
-
200
-
201
-
202
-
203
-
204
-
205
-
206
-
207
-
208
-
209
-
210
-
211
-
212
-
213
-
214
-
215
-
216
-
217
-
218
-
219
-
220
-
221
-
222
-
223
-
224
-
225
 |
 |

Table of Contents
• new product offerings such as BK Fresh Apple Fries, which received the “Kid Friendly Product of the
Year” award from the Glycemic Research Institute (GRI) in Washington, D.C., and Kraft® Macaroni and
Cheese;
• continued high guest satisfaction scores, as well as high speed of service and cleanliness scores; and
• net income up 6% to $200.1 million and diluted earnings per share up 6% to $1.46 per share for fiscal
2009 compared to fiscal 2008.
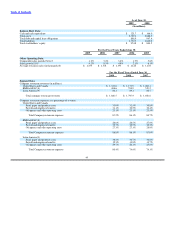
Key Business Measures
We use three key business measures as indicators of the Company’s operational performance: comparable sales growth, average
restaurant sales and sales growth. These measures are important indicators of the overall direction, trends of sales and the effectiveness
of the Company’s advertising, marketing and operating initiatives and the impact of these on the entire Burger King system.
Comparable sales growth and sales growth are provided by reportable segments and are analyzed on a constant currency basis, which
means they are calculated using the same exchange rate over the periods under comparison to remove the effects of currency
fluctuations from these trend analyses. We believe these constant currency measures provide a more meaningful analysis of our
business by identifying the underlying business trend, without distortion from the effect of currency movements.
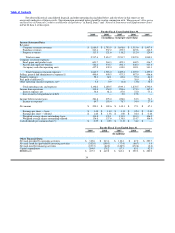
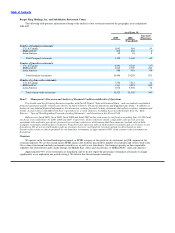
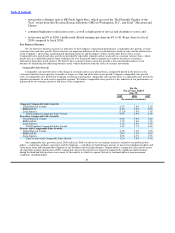
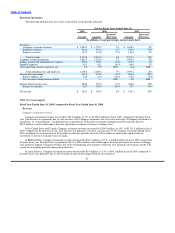
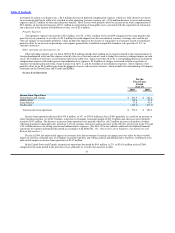
Comparable Sales Growth
Comparable sales growth refers to the change in restaurant sales in one period from a comparable period in the prior year for
restaurants that have been open for 13 months or longer as of the end of the most recent period. Company comparable sales growth
refers to comparable sales growth for Company restaurants and franchise comparable sales growth refers to comparable sales growth for
franchise restaurants, in each case by reportable segment. We believe comparable sales growth is a key indicator of our performance, as
influenced by our strategic initiatives and those of our competitors.
For the
Fiscal Years Ended
June 30,
2009 2008 2007
(In constant currencies)
Company Comparable Sales Growth:
United States & Canada 0.5% 2.6% 2.1%
EMEA/APAC 0.1% 3.8% 2.2%
Latin America (3.2)% 1.8% 1.1%
Total Company Comparable Sales Growth 0.3% 2.9% 2.1%
Franchise Comparable Sales Growth:
United States & Canada 0.4% 5.8% 3.8%
EMEA/APAC 3.3% 5.6% 3.1%
Latin America 2.3% 4.5% 3.7%
Total Franchise Comparable Sales Growth 1.4% 5.7% 3.6%
System−wide Comparable Sales Growth:
United States & Canada 0.4% 5.4% 3.6%
EMEA/APAC 2.9% 5.4% 3.0%
Latin America 1.9% 4.3% 3.5%
Total System−wide Comparable Sales Growth 1.2% 5.4% 3.4%
Our comparable sales growth in fiscal 2009 and fiscal 2008 was driven by our strategic initiatives related to our global growth
pillars — marketing, products, operations and development — including our barbell menu strategy of innovative indulgent products and
value menu items and continued development of our breakfast and late night dayparts. Despite positive comparable sales growth across
all reportable segments during fiscal 2009, comparable sales for the period were negatively impacted by significant traffic declines
during the third and forth quarters across many of the markets in which we operate, driven by continued adverse macroeconomic
conditions, including higher
46