Burger King 2009 Annual Report Download - page 41
Download and view the complete annual report
Please find page 41 of the 2009 Burger King annual report below. You can navigate through the pages in the report by either clicking on the pages listed below, or by using the keyword search tool below to find specific information within the annual report.-
 1
1 -
2
-
3
-
4
-
5
-
6
-
7
-
8
-
9
-
10
-
11
-
12
-
13
-
14
-
15
-
16
-
17
-
18
-
19
-
20
-
21
-
22
-
23
-
24
-
25
-
26
-
27
-
28
-
29
-
30
-
 31
31 -
 32
32 -
 33
33 -
 34
34 -
 35
35 -
 36
36 -
 37
37 -
 38
38 -
 39
39 -
 40
40 -
 41
41 -
 42
42 -
 43
43 -
 44
44 -
 45
45 -
 46
46 -
 47
47 -
 48
48 -
 49
49 -
 50
50 -
 51
51 -
52
-
53
-
54
-
55
-
56
-
57
-
58
-
59
-
60
-
61
-
62
-
63
-
64
-
65
-
66
-
67
-
68
-
69
-
70
-
71
-
72
-
73
-
74
-
75
-
76
-
77
-
78
-
79
-
80
-
81
-
82
-
83
-
84
-
85
-
86
-
87
-
88
-
89
-
90
-
91
-
92
-
93
-
94
-
95
-
96
-
97
-
98
-
99
-
100
-
101
-
102
-
103
-
104
-
105
-
106
-
107
-
108
-
109
-
110
-
111
-
112
-
113
-
114
-
115
-
116
-
117
-
118
-
119
-
120
-
121
-
122
-
123
-
124
-
125
-
126
-
127
-
128
-
129
-
130
-
131
-
132
-
133
-
134
-
135
-
136
-
137
-
138
-
139
-
140
-
141
-
142
-
143
-
144
-
145
-
146
-
147
-
148
-
149
-
150
-
151
-
152
-
153
-
154
-
155
-
156
-
157
-
158
-
159
-
160
-
161
-
162
-
163
-
164
-
165
-
166
-
167
-
168
-
169
-
170
-
171
-
172
-
173
-
174
-
175
-
176
-
177
-
178
-
179
-
180
-
181
-
182
-
183
-
184
-
185
-
186
-
187
-
188
-
189
-
190
-
191
-
192
-
193
-
194
-
195
-
196
-
197
-
198
-
199
-
200
-
201
-
202
-
203
-
204
-
205
-
206
-
207
-
208
-
209
-
210
-
211
-
212
-
213
-
214
-
215
-
216
-
217
-
218
-
219
-
220
-
221
-
222
-
223
-
224
-
225
 |
 |

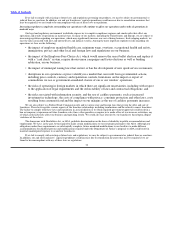
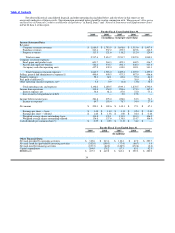
Table of Contents
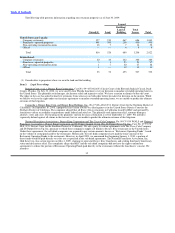
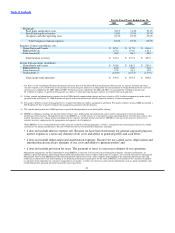
The selected historical consolidated financial and other operating data included below and elsewhere in this report are not
necessarily indicative of future results. The information presented below should be read in conjunction with “Management’s Discussion
and Analysis of Financial Condition and Results of Operations” in Part II, Item 7 and “Financial Statements and Supplementary Data”
in Part II, Item 8 of this report.
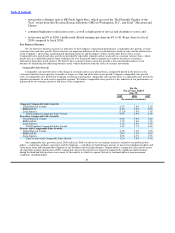
For the Fiscal Years Ended June 30,
2009 2008 2007 2006 2005
(In millions, except per share data)
Income Statement Data:
Revenues:
Company restaurant revenues $ 1,880.5 $ 1,795.9 $ 1,658.0 $ 1,515.6 $ 1,407.4
Franchise revenues 543.4 537.2 459.5 419.8 412.5
Property revenues 113.5 121.6 116.2 112.4 120.4
Total revenues 2,537.4 2,454.7 2,233.7 2,047.8 1,940.3
Company restaurant expenses:
Food, paper and product costs 603.7 564.3 499.3 469.5 436.7
Payroll and employee benefits 582.2 534.7 492.1 446.3 415.4
Occupancy and other operating costs 457.8 439.0 418.0 380.1 343.1
Total Company restaurant expenses 1,643.7 1,538.0 1,409.4 1,295.9 1,195.2
Selling, general and administrative expenses(1) 490.4 499.5 473.5 487.9 486.6
Property expenses 58.1 62.1 60.6 57.4 64.2
Fees paid to affiliates(2) — — — 38.9 8.8
Other operating (income) expenses, net* 5.8 0.9 (4.4) (3.6) 38.1
Total operating costs and expenses 2,198.0 2,100.5 1,939.1 1,876.5 1,792.9
Income from operations 339.4 354.2 294.6 171.3 147.4
Interest expense, net 54.6 61.2 67.0 72.0 73.1
Loss on early extinguishment of debt — — 0.8 17.8 —
Income before income taxes 284.8 293.0 226.8 81.5 74.3
Income tax expense* 84.7 103.4 78.7 54.4 27.0
Net income $ 200.1 $ 189.6 $ 148.1 $ 27.1 $ 47.3
Earnings per share — basic $ 1.48 $ 1.40 $ 1.11 $ 0.24 $ 0.44
Earnings per share — diluted $ 1.46 $ 1.38 $ 1.08 $ 0.24 $ 0.44
Weighted average shares outstanding−basic 134.8 135.1 133.9 110.3 106.5
Weighted average shares outstanding−diluted 136.8 137.6 136.8 114.7 106.9
Cash dividends per common share(3) $ 0.25 $ 0.25 $ 0.13 $ 3.42 $ —
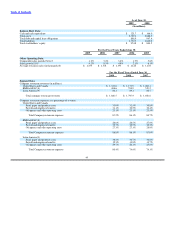
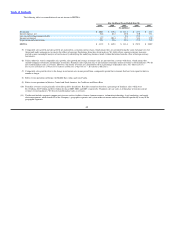
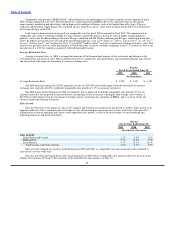
For the Fiscal Years Ended June 30,
2009 2008 2007 2006 2005
(In millions)
Other Financial Data:
Net cash provided by operating activities $ 310.8 $ 243.4 $ 110.4 $ 67.0 $ 209.7
Net cash (used for) provided by investing activities (242.0) (199.3) (77.4) (66.7) 3.4
Net cash used for financing activities (105.5) (62.0) (126.9) (172.6) (2.2)
Capital expenditures 204.0 178.2 87.3 85.1 92.5
EBITDA(4) $ 437.5 $ 449.8 $ 383.4 $ 259.2 $ 220.9
39