Burger King 2009 Annual Report Download - page 51
Download and view the complete annual report
Please find page 51 of the 2009 Burger King annual report below. You can navigate through the pages in the report by either clicking on the pages listed below, or by using the keyword search tool below to find specific information within the annual report.-
 1
1 -
2
-
3
-
4
-
5
-
6
-
7
-
8
-
9
-
10
-
11
-
12
-
13
-
14
-
15
-
16
-
17
-
18
-
19
-
20
-
21
-
22
-
23
-
24
-
25
-
26
-
27
-
28
-
29
-
30
-
31
-
32
-
33
-
34
-
35
-
36
-
37
-
38
-
39
-
40
-
 41
41 -
 42
42 -
 43
43 -
 44
44 -
 45
45 -
 46
46 -
 47
47 -
 48
48 -
 49
49 -
 50
50 -
 51
51 -
 52
52 -
 53
53 -
 54
54 -
 55
55 -
 56
56 -
 57
57 -
 58
58 -
 59
59 -
 60
60 -
 61
61 -
62
-
63
-
64
-
65
-
66
-
67
-
68
-
69
-
70
-
71
-
72
-
73
-
74
-
75
-
76
-
77
-
78
-
79
-
80
-
81
-
82
-
83
-
84
-
85
-
86
-
87
-
88
-
89
-
90
-
91
-
92
-
93
-
94
-
95
-
96
-
97
-
98
-
99
-
100
-
101
-
102
-
103
-
104
-
105
-
106
-
107
-
108
-
109
-
110
-
111
-
112
-
113
-
114
-
115
-
116
-
117
-
118
-
119
-
120
-
121
-
122
-
123
-
124
-
125
-
126
-
127
-
128
-
129
-
130
-
131
-
132
-
133
-
134
-
135
-
136
-
137
-
138
-
139
-
140
-
141
-
142
-
143
-
144
-
145
-
146
-
147
-
148
-
149
-
150
-
151
-
152
-
153
-
154
-
155
-
156
-
157
-
158
-
159
-
160
-
161
-
162
-
163
-
164
-
165
-
166
-
167
-
168
-
169
-
170
-
171
-
172
-
173
-
174
-
175
-
176
-
177
-
178
-
179
-
180
-
181
-
182
-
183
-
184
-
185
-
186
-
187
-
188
-
189
-
190
-
191
-
192
-
193
-
194
-
195
-
196
-
197
-
198
-
199
-
200
-
201
-
202
-
203
-
204
-
205
-
206
-
207
-
208
-
209
-
210
-
211
-
212
-
213
-
214
-
215
-
216
-
217
-
218
-
219
-
220
-
221
-
222
-
223
-
224
-
225
 |
 |

Table of Contents
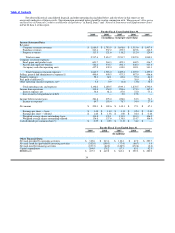
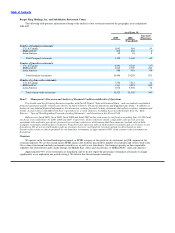
2009, compared to 7,512 restaurants as of June 30, 2008, reflecting a less than 1% increase in the number of restaurants.
Our sales growth in the United States and Canada during fiscal 2008, reflects positive comparable sales growth and an increase in
the amount of revenues earned by new restaurants. We had 7,512 restaurants in the United States and Canada as of June 30, 2008,
compared to 7,488 restaurants as of June 30, 2007.
EMEA/APAC demonstrated sales growth during fiscal 2009, reflecting net openings of new restaurants and comparable sales
growth in most major markets with the exception of Germany, where adverse macroeconomic conditions have resulted in negative
comparable sales growth. We had 3,313 restaurants in EMEA/APAC as of June 30, 2009, compared to 3,051 restaurants as of June 30,
2008, a 9% increase in the number of restaurants.
EMEA/APAC demonstrated strong sales growth during fiscal 2008 reflecting net openings of new restaurants and comparable
sales growth in most major markets. We had 3,051 restaurants in EMEA/APAC as of June 30, 2008, compared to 2,892 restaurants as
of June 30, 2007, a 5% increase in the number of restaurants.
Latin America’s sales growth was driven by new restaurant openings and positive comparable sales in fiscal 2009. We had 1,078
restaurants in Latin America as of June 30, 2009, compared to 1,002 restaurants as of June 30, 2008, an 8% increase in the number of
restaurants.
Latin America’s sales growth was driven by new restaurant openings and strong comparable sales growth in fiscal 2008.
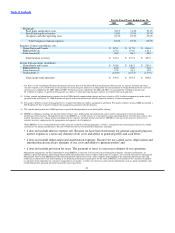
Factors Affecting Comparability of Results
Termination of Global Headquarters Lease
In May 2007, BKC terminated the lease for its proposed new global headquarters facility, which was to be constructed in Coral
Gables, Florida (the “Coral Gables Lease”). We determined that remaining at our current headquarters location would avoid the cost
and disruption of moving to a new facility and that the current headquarters facility would continue to meet our needs for a global
headquarters more effectively and cost efficiently. The Coral Gables Lease provided for the lease of approximately 225,000 square feet
for a term of 15 years at an estimated initial annual rent of approximately $5.6 million per year, subject to escalations. By terminating
the Coral Gables Lease, we estimated at the time of the transaction savings of approximately $24.0 million in future rent payments
between October 2008 and September 2018 and approximately $23.0 million of tenant improvements and moving costs, which were
expected to be paid over an 18−month period. Total costs associated with the termination of the Coral Gables Lease were $6.7 million,
including a termination fee of $5.0 million we paid to the landlord, which includes a reimbursement of the landlord’s expenses. See
Note 20 to the Consolidated Financial Statements in Part II, Item 8 of this Form 10−K. These costs are reflected in other operating
(income) expense, net in our consolidated statements of income for fiscal 2007.
49