Burger King 2009 Annual Report Download - page 108
Download and view the complete annual report
Please find page 108 of the 2009 Burger King annual report below. You can navigate through the pages in the report by either clicking on the pages listed below, or by using the keyword search tool below to find specific information within the annual report.-
 1
1 -
2
-
3
-
4
-
5
-
6
-
7
-
8
-
9
-
10
-
11
-
12
-
13
-
14
-
15
-
16
-
17
-
18
-
19
-
20
-
21
-
22
-
23
-
24
-
25
-
26
-
27
-
28
-
29
-
30
-
31
-
32
-
33
-
34
-
35
-
36
-
37
-
38
-
39
-
40
-
41
-
42
-
43
-
44
-
45
-
46
-
47
-
48
-
49
-
50
-
51
-
52
-
53
-
54
-
55
-
56
-
57
-
58
-
59
-
60
-
61
-
62
-
63
-
64
-
65
-
66
-
67
-
68
-
69
-
70
-
71
-
72
-
73
-
74
-
75
-
76
-
77
-
78
-
79
-
80
-
81
-
82
-
83
-
84
-
85
-
86
-
87
-
88
-
89
-
90
-
91
-
92
-
93
-
94
-
95
-
96
-
97
-
 98
98 -
 99
99 -
 100
100 -
 101
101 -
 102
102 -
 103
103 -
 104
104 -
 105
105 -
 106
106 -
 107
107 -
 108
108 -
 109
109 -
 110
110 -
 111
111 -
 112
112 -
 113
113 -
 114
114 -
 115
115 -
 116
116 -
 117
117 -
 118
118 -
119
-
120
-
121
-
122
-
123
-
124
-
125
-
126
-
127
-
128
-
129
-
130
-
131
-
132
-
133
-
134
-
135
-
136
-
137
-
138
-
139
-
140
-
141
-
142
-
143
-
144
-
145
-
146
-
147
-
148
-
149
-
150
-
151
-
152
-
153
-
154
-
155
-
156
-
157
-
158
-
159
-
160
-
161
-
162
-
163
-
164
-
165
-
166
-
167
-
168
-
169
-
170
-
171
-
172
-
173
-
174
-
175
-
176
-
177
-
178
-
179
-
180
-
181
-
182
-
183
-
184
-
185
-
186
-
187
-
188
-
189
-
190
-
191
-
192
-
193
-
194
-
195
-
196
-
197
-
198
-
199
-
200
-
201
-
202
-
203
-
204
-
205
-
206
-
207
-
208
-
209
-
210
-
211
-
212
-
213
-
214
-
215
-
216
-
217
-
218
-
219
-
220
-
221
-
222
-
223
-
224
-
225
 |
 |

Table of Contents
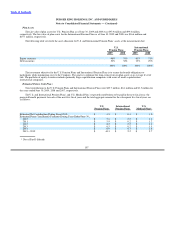
BURGER KING HOLDINGS, INC. AND SUBSIDIARIES
Notes to Consolidated Financial Statements — (Continued)
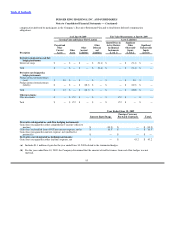
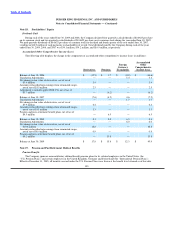
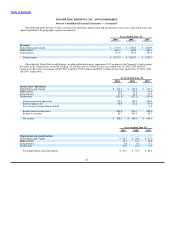
U.S. International U.S.
Pension Plans Pension Plans Medical Plan
2009 2008 2009 2008 2009 2008
Amounts recognized in the consolidated balance sheet
as of June 30, 2009
Current liabilities $ (1.0) $ (1.0) $ (0.1) $ — $ (1.0) $ (0.9)
Noncurrent liabilities (47.1) (47.8) (6.9) (6.0) (21.1) (21.4)
Net pension liability, end of fiscal year $ (48.1) $ (48.8) $ (7.0) $ (6.0) $ (22.1) $ (22.3)
Amounts recognized in accumulated other
comprehensive income (AOCI)
Unrecognized actuarial loss (gain) $ 31.2 $ 7.1 $ (1.3) $ (1.1) $ (5.4) $ (3.9)
Total AOCI (before tax) $ 31.2 $ 7.1 $ (1.3) $ (1.1) $ (5.4) $ (3.9)
The estimated net gain for the International Pension Plans and the U.S. Medical Plans that will be amortized from accumulated
other comprehensive gain into net periodic benefit costs in the year ending June 30, 2010 is not significant.
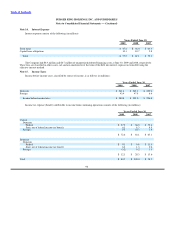
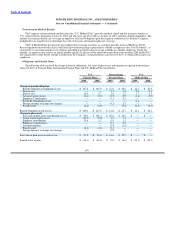
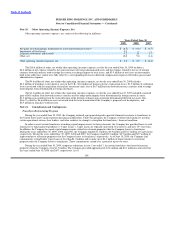
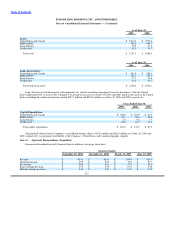
Additional year−end information for the U.S. Pension Plans, International Pension Plans and U.S. Medical Plan with
accumulated benefit obligations in excess of plan assets
The following sets forth the projected benefit obligation, accumulated benefit obligation and fair value of plan assets for the
U.S. Pension Plans, International Pension Plans and U.S. Medical Plan with accumulated benefit obligations in excess of plan assets (in
millions):
U.S. International U.S.
Pension Plans Pension Plans Medical Plan
2009 2008 2009 2008 2009 2008
Projected benefit obligation $ 146.0 $ 147.8 $ 7.3 $ 5.8 $ 22.1 $ 22.3
Accumulated benefit obligation $ 146.0 $ 147.8 $ 6.4 $ 5.1 $ 22.1 $ 22.3
Fair value of plan assets $ 97.9 $ 99.0 $ 1.3 $ — $ — $ —
As of June 30, 2009, for International Pension Plans, accumulated benefit obligations in excess of plan assets relates to the
Germany pension plan, which had no assets in this plan.
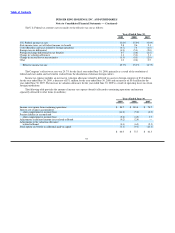
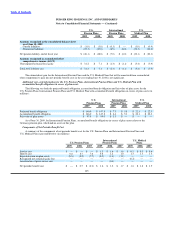
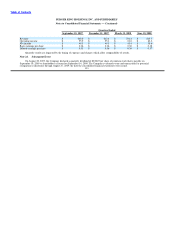
Components of Net Periodic Benefit Cost
A summary of the components of net periodic benefit cost for the U.S. Pension Plans and International Pension Plans and
U.S. Medical Plan is presented below (in millions):
International U.S. Medical
U.S. Pension Plans Pension Plans Plans
2009 2008 2007 2009 2008 2007 2009 2008 2007
Service cost $ — $ — $ — $ 1.3 $ 1.6 $ 1.8 $ 0.5 $ 0.5 $ 0.6
Interest cost 8.8 8.7 7.6 0.8 1.2 1.0 1.3 1.3 1.3
Expected return on plan assets (8.8) (8.2) (7.7) (0.5) (1.3) (1.1) — — —
Recognized net actuarial (gain) loss — — — — — — (0.2) — —
Amortization of prior service cost — — — — (0.3) — — — —
Net periodic benefit cost $ — $ 0.5 $ (0.1) $ 1.6 $ 1.2 $ 1.7 $ 1.6 $ 1.8 $ 1.9
105