Burger King 2009 Annual Report Download - page 10
Download and view the complete annual report
Please find page 10 of the 2009 Burger King annual report below. You can navigate through the pages in the report by either clicking on the pages listed below, or by using the keyword search tool below to find specific information within the annual report.-
 1
1 -
 2
2 -
 3
3 -
 4
4 -
 5
5 -
 6
6 -
 7
7 -
 8
8 -
 9
9 -
 10
10 -
 11
11 -
 12
12 -
 13
13 -
 14
14 -
 15
15 -
 16
16 -
 17
17 -
 18
18 -
 19
19 -
 20
20 -
 21
21 -
22
-
23
-
24
-
25
-
26
-
27
-
28
-
29
-
30
-
31
-
32
-
33
-
34
-
35
-
36
-
37
-
38
-
39
-
40
-
41
-
42
-
43
-
44
-
45
-
46
-
47
-
48
-
49
-
50
-
51
-
52
-
53
-
54
-
55
-
56
-
57
-
58
-
59
-
60
-
61
-
62
-
63
-
64
-
65
-
66
-
67
-
68
-
69
-
70
-
71
-
72
-
73
-
74
-
75
-
76
-
77
-
78
-
79
-
80
-
81
-
82
-
83
-
84
-
85
-
86
-
87
-
88
-
89
-
90
-
91
-
92
-
93
-
94
-
95
-
96
-
97
-
98
-
99
-
100
-
101
-
102
-
103
-
104
-
105
-
106
-
107
-
108
-
109
-
110
-
111
-
112
-
113
-
114
-
115
-
116
-
117
-
118
-
119
-
120
-
121
-
122
-
123
-
124
-
125
-
126
-
127
-
128
-
129
-
130
-
131
-
132
-
133
-
134
-
135
-
136
-
137
-
138
-
139
-
140
-
141
-
142
-
143
-
144
-
145
-
146
-
147
-
148
-
149
-
150
-
151
-
152
-
153
-
154
-
155
-
156
-
157
-
158
-
159
-
160
-
161
-
162
-
163
-
164
-
165
-
166
-
167
-
168
-
169
-
170
-
171
-
172
-
173
-
174
-
175
-
176
-
177
-
178
-
179
-
180
-
181
-
182
-
183
-
184
-
185
-
186
-
187
-
188
-
189
-
190
-
191
-
192
-
193
-
194
-
195
-
196
-
197
-
198
-
199
-
200
-
201
-
202
-
203
-
204
-
205
-
206
-
207
-
208
-
209
-
210
-
211
-
212
-
213
-
214
-
215
-
216
-
217
-
218
-
219
-
220
-
221
-
222
-
223
-
224
-
225
 |
 |

Table of Contents
Each franchisee wishing to develop a new restaurant is responsible for selecting a new site location and bears the risk if the new
site does not meet the franchisee’s investment expectations. However, we work closely with our franchisees to assist them in selecting
sites. Each restaurant site selected is required to be within an identified trade area and our development committee reviews all
selections, provides input based on the same factors that it uses to select Company restaurants, and grants final approval.
We increased our restaurant count in the United States and Canada by 22 restaurants during fiscal 2009. We have instituted several
initiatives to accelerate restaurant development in the United States, including reduced upfront franchise fees, process simplifications
and turnkey development assistance programs, which reduce the time and uncertainty associated with opening new restaurants.
Company Restaurants
As of June 30, 2009, we owned and operated 1,043 Company restaurants in the United States and Canada, representing 14% of
total United States and Canada system−wide restaurants. We own the properties for 357 of our Company restaurants and we lease the
remaining 686 properties from third−party landlords. Our Company restaurants in the United States and Canada generated $1.3 billion
in revenues in fiscal 2009, or 76% of our total United States and Canada revenues and 53% of our total worldwide revenues. We use our
Company restaurants to test new products and initiatives before rolling them out to the wider Burger King system.
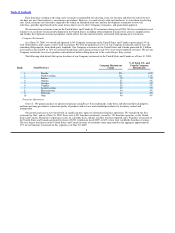
The following table details the top ten locations of our Company restaurants in the United States and Canada as of June 30, 2009:
% of Total U.S. and
Company Restaurant Canada Company
Rank State/Province Count Restaurants
1 Florida 251 24%
2 North Carolina 111 11%
3 Indiana 70 7%
4 Ontario 57 5%
5 Georgia 55 5%
6 Virginia 50 5%
7 South Carolina 49 5%
8 Massachusetts 44 4%
9 Nebraska 42 4%
10 Ohio 40 4%
Franchise Operations
General. We grant franchises to operate restaurants using Burger King trademarks, trade dress and other intellectual property,
uniform operating procedures, consistent quality of products and services and standard procedures for inventory control and
management.
Our growth and success have been built, in significant part, upon our substantial franchise operations. We franchised our first
restaurant in 1961, and as of June 30, 2009, there were 6,491 franchise restaurants, owned by 767 franchise operators, in the United
States and Canada. Franchisees report gross sales on a monthly basis and pay royalties based on reported sales. Franchise restaurants in
the United States and Canada generated revenues of $323.1 million in fiscal 2009, or 60% of our total worldwide franchise revenues.
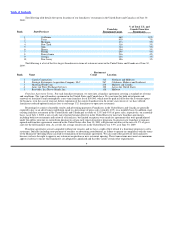
The five largest franchisees in the United States and Canada in terms of restaurant count represented in the aggregate approximately
17% of our franchise restaurants in this segment as of June 30, 2009.
8