Burger King 2009 Annual Report Download - page 56
Download and view the complete annual report
Please find page 56 of the 2009 Burger King annual report below. You can navigate through the pages in the report by either clicking on the pages listed below, or by using the keyword search tool below to find specific information within the annual report.-
 1
1 -
2
-
3
-
4
-
5
-
6
-
7
-
8
-
9
-
10
-
11
-
12
-
13
-
14
-
15
-
16
-
17
-
18
-
19
-
20
-
21
-
22
-
23
-
24
-
25
-
26
-
27
-
28
-
29
-
30
-
31
-
32
-
33
-
34
-
35
-
36
-
37
-
38
-
39
-
40
-
41
-
42
-
43
-
44
-
45
-
 46
46 -
 47
47 -
 48
48 -
 49
49 -
 50
50 -
 51
51 -
 52
52 -
 53
53 -
 54
54 -
 55
55 -
 56
56 -
 57
57 -
 58
58 -
 59
59 -
 60
60 -
 61
61 -
 62
62 -
 63
63 -
 64
64 -
 65
65 -
 66
66 -
67
-
68
-
69
-
70
-
71
-
72
-
73
-
74
-
75
-
76
-
77
-
78
-
79
-
80
-
81
-
82
-
83
-
84
-
85
-
86
-
87
-
88
-
89
-
90
-
91
-
92
-
93
-
94
-
95
-
96
-
97
-
98
-
99
-
100
-
101
-
102
-
103
-
104
-
105
-
106
-
107
-
108
-
109
-
110
-
111
-
112
-
113
-
114
-
115
-
116
-
117
-
118
-
119
-
120
-
121
-
122
-
123
-
124
-
125
-
126
-
127
-
128
-
129
-
130
-
131
-
132
-
133
-
134
-
135
-
136
-
137
-
138
-
139
-
140
-
141
-
142
-
143
-
144
-
145
-
146
-
147
-
148
-
149
-
150
-
151
-
152
-
153
-
154
-
155
-
156
-
157
-
158
-
159
-
160
-
161
-
162
-
163
-
164
-
165
-
166
-
167
-
168
-
169
-
170
-
171
-
172
-
173
-
174
-
175
-
176
-
177
-
178
-
179
-
180
-
181
-
182
-
183
-
184
-
185
-
186
-
187
-
188
-
189
-
190
-
191
-
192
-
193
-
194
-
195
-
196
-
197
-
198
-
199
-
200
-
201
-
202
-
203
-
204
-
205
-
206
-
207
-
208
-
209
-
210
-
211
-
212
-
213
-
214
-
215
-
216
-
217
-
218
-
219
-
220
-
221
-
222
-
223
-
224
-
225
 |
 |

Table of Contents
movement of currency exchange rates, a $2.4 million decrease in deferred compensation expense, which was fully offset by net losses
on investments held in the rabbi trust recorded in other operating (income) expense, net, a $1.8 million decrease in travel and meeting
expenses and $2.5 million of other miscellaneous benefits. These factors were partially offset by an increase in stock compensation of
$5.0 million, an incremental increase of $3.1 million in amortization of intangible assets associated with the acquisition of restaurants,
and a decrease in the amount of bad debt recoveries, net of $2.6 million.
Property Expenses
Total property expenses decreased by $4.0 million, or 6.4%, to $58.1 million for fiscal 2009 compared to the same period in the
prior fiscal year, primarily as a result of a $5.2 million favorable impact from the movement of currency exchange rates and the net
effect of changes to our property portfolio, which includes the impact of the closure or acquisition of restaurants leased to franchisees,
partially offset by an increase in percentage rent expense generated by worldwide comparable franchise sales growth of 1.4% (in
constant currencies).
Other operating (income) expense, net
Other operating expense, net, for fiscal 2009 of $5.8 million includes $6.8 million of net expense related to the remeasurement of
foreign denominated assets and the expense related to the use of forward contracts used to hedge the currency exchange impact on such
assets, $3.9 million of net losses on investments held in the rabbi trust, which were fully offset by a corresponding decrease in deferred
compensation expense reflected in general and administrative expenses, $1.8 million of charges associated with the acquisition of
franchise restaurants primarily from a large franchisee in the U.S. and $1.8 million of miscellaneous expenses. These expenses were
partially offset by an $8.5 million gain from the disposal of assets and restaurant closures, which includes the refranchising of Company
restaurants in the United States and Canada and EMEA.
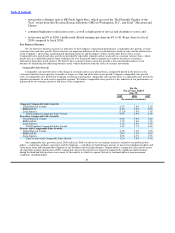
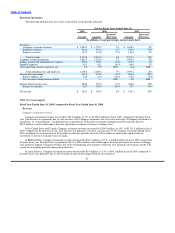
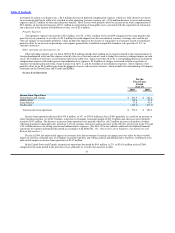
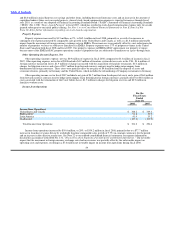
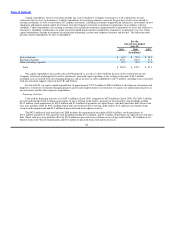
Income from Operations
For the
Fiscal Years
Ended
June 30,
2009 2008
Income from Operations:
United States and Canada $ 341.8 $ 348.2
EMEA/APAC 83.6 91.8
Latin America 37.8 41.4
Unallocated (123.8) (127.2)
Total income from operations $ 339.4 $ 354.2
Income from operations decreased by $14.8 million, or 4%, to $339.4 million in fiscal 2009, primarily as a result of an increase in
other operating expense, net of $4.9 million, a decrease in Company restaurant margin of $21.1 million and a decrease in net property
income of $4.1 million. The decrease in income from operations was partially offset by a $6.2 million increase in franchise revenues,
reflecting franchise comparable sales growth of 1.4% (in constant currencies) and an increase in the effective royalty rate in the U.S and
a $9.1 million decrease in selling, general and administrative expenses. (See Note 22 to our audited condensed consolidated financial
statements for segment information disclosed in accordance with SFAS No. 131, “Disclosures about Segments of an Enterprise and
Related Information”).
For fiscal 2009, the unfavorable impact on revenues from the movement of currency exchange rates was offset by the favorable
impact of currency exchange rates on Company restaurant expenses and selling, general and administrative expenses, resulting in a net
unfavorable impact on income from operations of $14.9 million.
In the United States and Canada, income from operations decreased by $6.4 million, or 2%, to $341.8 million in fiscal 2009,
compared to the same period in the prior fiscal year, primarily as a result of an increase in other
54