Burger King 2009 Annual Report Download - page 57
Download and view the complete annual report
Please find page 57 of the 2009 Burger King annual report below. You can navigate through the pages in the report by either clicking on the pages listed below, or by using the keyword search tool below to find specific information within the annual report.-
 1
1 -
2
-
3
-
4
-
5
-
6
-
7
-
8
-
9
-
10
-
11
-
12
-
13
-
14
-
15
-
16
-
17
-
18
-
19
-
20
-
21
-
22
-
23
-
24
-
25
-
26
-
27
-
28
-
29
-
30
-
31
-
32
-
33
-
34
-
35
-
36
-
37
-
38
-
39
-
40
-
41
-
42
-
43
-
44
-
45
-
46
-
 47
47 -
 48
48 -
 49
49 -
 50
50 -
 51
51 -
 52
52 -
 53
53 -
 54
54 -
 55
55 -
 56
56 -
 57
57 -
 58
58 -
 59
59 -
 60
60 -
 61
61 -
 62
62 -
 63
63 -
 64
64 -
 65
65 -
 66
66 -
 67
67 -
68
-
69
-
70
-
71
-
72
-
73
-
74
-
75
-
76
-
77
-
78
-
79
-
80
-
81
-
82
-
83
-
84
-
85
-
86
-
87
-
88
-
89
-
90
-
91
-
92
-
93
-
94
-
95
-
96
-
97
-
98
-
99
-
100
-
101
-
102
-
103
-
104
-
105
-
106
-
107
-
108
-
109
-
110
-
111
-
112
-
113
-
114
-
115
-
116
-
117
-
118
-
119
-
120
-
121
-
122
-
123
-
124
-
125
-
126
-
127
-
128
-
129
-
130
-
131
-
132
-
133
-
134
-
135
-
136
-
137
-
138
-
139
-
140
-
141
-
142
-
143
-
144
-
145
-
146
-
147
-
148
-
149
-
150
-
151
-
152
-
153
-
154
-
155
-
156
-
157
-
158
-
159
-
160
-
161
-
162
-
163
-
164
-
165
-
166
-
167
-
168
-
169
-
170
-
171
-
172
-
173
-
174
-
175
-
176
-
177
-
178
-
179
-
180
-
181
-
182
-
183
-
184
-
185
-
186
-
187
-
188
-
189
-
190
-
191
-
192
-
193
-
194
-
195
-
196
-
197
-
198
-
199
-
200
-
201
-
202
-
203
-
204
-
205
-
206
-
207
-
208
-
209
-
210
-
211
-
212
-
213
-
214
-
215
-
216
-
217
-
218
-
219
-
220
-
221
-
222
-
223
-
224
-
225
 |
 |

Table of Contents
operating expense, net of $9.3 million, an increase in selling, general and administrative expenses of $7.3 million and a decrease in net
property income of $0.4 million, partially offset by an increase in Company restaurant margin of $7.2 million and $5.2 million increase
in franchise revenues, reflecting franchise comparable sales growth of 0.4% (in constant currencies) and an increase in the effective
royalty rate in the U.S.
In EMEA/APAC, income from operations decreased by $8.2 million, or 9%, to $83.6 million in fiscal 2009, primarily as a result
of a decrease in Company restaurant margin of $22.2 million, and a decrease in net property income of $2.0 million, partially offset by
an increase in other operating income, net of $3.5 million, a $12.2 million decrease in selling, general and administrative expenses and a
$0.4 million increase in franchise revenues, reflecting franchise comparable sales growth of 3.3% (in constant currencies). These factors
reflect an $11.9 million unfavorable impact from the movement of currency exchange rates.
In Latin America, income from operations decreased by $3.6 million, or 9%, to $37.8 million in fiscal 2009, primarily as a result
of a decrease in Company restaurant margin of $6.1 million, partially offset by a $0.9 million decrease in selling, general and
administrative expenses, a decrease in other operating expense, net of $0.9 million and a $0.6 million increase in franchise revenues,
which reflects franchise comparable sales growth of 2.3% (in constant currencies). These factors reflect a $2.9 million unfavorable
impact from the movement of currency exchange rates.
Our unallocated corporate expenses decreased by $3.4 million in fiscal 2009, compared to the same period in the prior fiscal year,
primarily as a result of a decrease in general and administrative expenses attributable to savings from cost containment initiatives.
Interest Expense, net
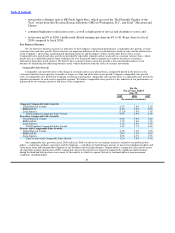
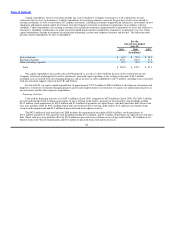
Interest expense, net decreased by $6.6 million during fiscal 2009, compared to the prior fiscal year, primarily reflecting a
decrease in rates paid on borrowings during the period. The weighted average interest rates for the fiscal years ended June 30, 2009 and
2008 were 5.1% and 6.02%, respectively, which included the impact of interest rate swaps on 70.6% and 56.0% of our term debt,
respectively.
Income Tax Expense
Income tax expense was $84.7 million in fiscal 2009, resulting in an effective tax rate of 29.7% primarily due to the resolution of
federal and state audits and tax benefits realized from the dissolution of dormant foreign entities.
See Note 15 to our consolidated financial statements for further information regarding our effective tax rate. See Item 1A “Risk
Factors” in Part I of this report for a discussion regarding our ability to utilize foreign tax credits and estimate deferred tax assets.
Net Income
Our net income increased by $10.5 million, or 6%, to $200.1 million in fiscal 2009 compared to the same period in the prior fiscal
year, primarily as a result of an $18.7 million decrease in income tax expense, increased franchise revenues of $6.2 million, driven by a
net increase in restaurants and positive franchise comparable sales growth, a $9.1 million decrease in selling, general and administrative
expenses and the benefit from a $6.6 million decrease in interest expense, net. These factors were partially offset by a net change of
$4.9 million in other operating expense, net, a decrease in Company restaurant margin of $21.1 million and a decrease in net property
income of $4.1 million.
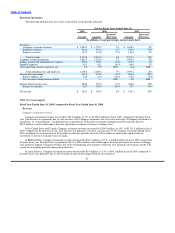
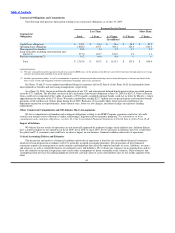
Fiscal Year Ended June 30, 2008 Compared to Fiscal Year Ended June 30, 2007
Revenues
Company Restaurant Revenues
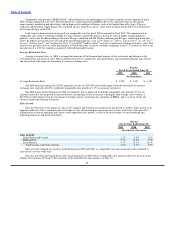
Total Company restaurant revenues increased by $137.9 million, or 8%, to $1.8 billion in fiscal 2008, primarily as a result of the
addition of 57 Company restaurants (net of closures and refranchisings) during fiscal 2008 and worldwide Company comparable sales
growth of 2.9% (in constant currencies). Approximately $70.2 million, or
55