Burger King 2009 Annual Report Download - page 85
Download and view the complete annual report
Please find page 85 of the 2009 Burger King annual report below. You can navigate through the pages in the report by either clicking on the pages listed below, or by using the keyword search tool below to find specific information within the annual report.-
 1
1 -
2
-
3
-
4
-
5
-
6
-
7
-
8
-
9
-
10
-
11
-
12
-
13
-
14
-
15
-
16
-
17
-
18
-
19
-
20
-
21
-
22
-
23
-
24
-
25
-
26
-
27
-
28
-
29
-
30
-
31
-
32
-
33
-
34
-
35
-
36
-
37
-
38
-
39
-
40
-
41
-
42
-
43
-
44
-
45
-
46
-
47
-
48
-
49
-
50
-
51
-
52
-
53
-
54
-
55
-
56
-
57
-
58
-
59
-
60
-
61
-
62
-
63
-
64
-
65
-
66
-
67
-
68
-
69
-
70
-
71
-
72
-
73
-
74
-
 75
75 -
 76
76 -
 77
77 -
 78
78 -
 79
79 -
 80
80 -
 81
81 -
 82
82 -
 83
83 -
 84
84 -
 85
85 -
 86
86 -
 87
87 -
 88
88 -
 89
89 -
 90
90 -
 91
91 -
 92
92 -
 93
93 -
 94
94 -
 95
95 -
96
-
97
-
98
-
99
-
100
-
101
-
102
-
103
-
104
-
105
-
106
-
107
-
108
-
109
-
110
-
111
-
112
-
113
-
114
-
115
-
116
-
117
-
118
-
119
-
120
-
121
-
122
-
123
-
124
-
125
-
126
-
127
-
128
-
129
-
130
-
131
-
132
-
133
-
134
-
135
-
136
-
137
-
138
-
139
-
140
-
141
-
142
-
143
-
144
-
145
-
146
-
147
-
148
-
149
-
150
-
151
-
152
-
153
-
154
-
155
-
156
-
157
-
158
-
159
-
160
-
161
-
162
-
163
-
164
-
165
-
166
-
167
-
168
-
169
-
170
-
171
-
172
-
173
-
174
-
175
-
176
-
177
-
178
-
179
-
180
-
181
-
182
-
183
-
184
-
185
-
186
-
187
-
188
-
189
-
190
-
191
-
192
-
193
-
194
-
195
-
196
-
197
-
198
-
199
-
200
-
201
-
202
-
203
-
204
-
205
-
206
-
207
-
208
-
209
-
210
-
211
-
212
-
213
-
214
-
215
-
216
-
217
-
218
-
219
-
220
-
221
-
222
-
223
-
224
-
225
 |
 |

Table of Contents
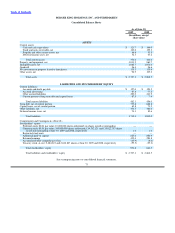
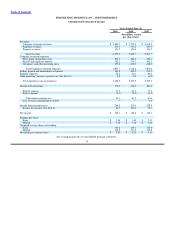
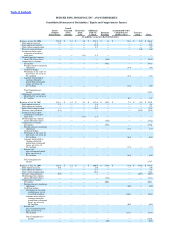
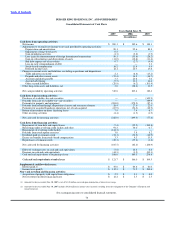
BURGER KING HOLDINGS, INC. AND SUBSIDIARIES
Notes to Consolidated Financial Statements — (Continued)
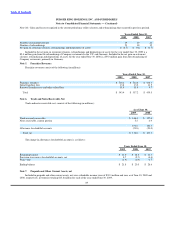
Certain of the Company’s derivatives are valued using various pricing models or discounted cash flow analyses that incorporate
observable market parameters, such as interest rate yield curves, option volatilities and currency rates, classified as Level 2 within the
valuation hierarchy. In accordance with the requirements of SFAS No. 157, derivative valuations incorporate credit risk adjustments
that are necessary to reflect the probability of default by the counterparty or the Company.
The carrying amounts for cash and equivalents, trade accounts and notes receivable and accounts and drafts receivable
approximate fair value based on the short−term nature of these accounts.
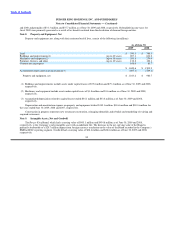
Restricted investments, consisting of investment securities held in a rabbi trust to invest compensation deferred under the
Company’s Executive Retirement Plan and fund future deferred compensation obligations, are carried at fair value, with net unrealized
gains and losses recorded in the Company’s consolidated statements of income. The fair value of these investment securities are
determined using quoted market prices in active markets.
At June 30, 2009, the fair value of the Company’s variable rate term debt was estimated at $791.9 million, compared to a carrying
amount of $816.4 million. This fair value was estimated using quoted market prices and are similar to Level 2 inputs within the
SFAS No. 157 valuation hierarchy.
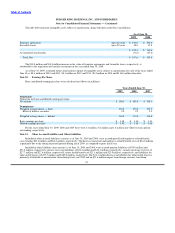
Revenue Recognition
Revenues include retail sales at Company restaurants and franchise and property revenues. Franchise revenues include royalties
and initial and renewal franchise fees. Property revenues include rental income from operating lease rentals and earned income on direct
financing leases on property leased or subleased to franchisees. Retail sales at Company restaurants are recognized at the point of sale
and royalties from franchisees are based on a percentage of retail sales reported by franchisees. The Company presents sales net of sales
tax and other sales−related taxes. Royalties are recognized when collectibility is reasonably assured. Initial franchise fees are
recognized as revenue when the related restaurant begins operations. A franchisee may pay a renewal franchise fee and renew its
franchise for an additional term. Renewal franchise fees are recognized as revenue upon receipt of the non−refundable fee and
execution of a new franchise agreement. The cost recovery accounting method is used to recognize revenues for franchisees for whom
collectibility is not reasonably assured. Rental income on operating lease rentals and earned income on direct financing leases are
recognized when collectibility is reasonably assured.
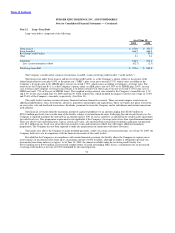
Advertising and Promotional Costs
The Company expenses the production costs of advertising when the advertisements are first aired or displayed. All other
advertising and promotional costs are expensed in the period incurred.
Franchise restaurants and Company restaurants contribute to advertising funds managed by the Company in the United States and
certain international markets where Company restaurants operate. Under the Company’s franchise agreements, contributions received
from franchisees must be spent on advertising, marketing and related activities, and result in no gross profit recognized by the
Company. Advertising expense, net of franchisee contributions, totaled $93.3 million for the year ended June 30, 2009, $91.5 million
for the year ended June 30, 2008, and $87.5 million for the year ended June 30, 2007, and is included in selling, general and
administrative expenses in the accompanying consolidated statements of income.
To the extent that contributions received exceed advertising and promotional expenditures, the excess contributions are accounted
for as a deferred liability and are recorded in accrued advertising in the accompanying consolidated balance sheets.
Franchisees in markets where no Company restaurants operate contribute to advertising funds not managed by the Company. Such
contributions and related fund expenditures are not reflected in the Company’s results of operations or financial position.
82