Burger King 2009 Annual Report Download - page 50
Download and view the complete annual report
Please find page 50 of the 2009 Burger King annual report below. You can navigate through the pages in the report by either clicking on the pages listed below, or by using the keyword search tool below to find specific information within the annual report.-
 1
1 -
2
-
3
-
4
-
5
-
6
-
7
-
8
-
9
-
10
-
11
-
12
-
13
-
14
-
15
-
16
-
17
-
18
-
19
-
20
-
21
-
22
-
23
-
24
-
25
-
26
-
27
-
28
-
29
-
30
-
31
-
32
-
33
-
34
-
35
-
36
-
37
-
38
-
39
-
 40
40 -
 41
41 -
 42
42 -
 43
43 -
 44
44 -
 45
45 -
 46
46 -
 47
47 -
 48
48 -
 49
49 -
 50
50 -
 51
51 -
 52
52 -
 53
53 -
 54
54 -
 55
55 -
 56
56 -
 57
57 -
 58
58 -
 59
59 -
 60
60 -
61
-
62
-
63
-
64
-
65
-
66
-
67
-
68
-
69
-
70
-
71
-
72
-
73
-
74
-
75
-
76
-
77
-
78
-
79
-
80
-
81
-
82
-
83
-
84
-
85
-
86
-
87
-
88
-
89
-
90
-
91
-
92
-
93
-
94
-
95
-
96
-
97
-
98
-
99
-
100
-
101
-
102
-
103
-
104
-
105
-
106
-
107
-
108
-
109
-
110
-
111
-
112
-
113
-
114
-
115
-
116
-
117
-
118
-
119
-
120
-
121
-
122
-
123
-
124
-
125
-
126
-
127
-
128
-
129
-
130
-
131
-
132
-
133
-
134
-
135
-
136
-
137
-
138
-
139
-
140
-
141
-
142
-
143
-
144
-
145
-
146
-
147
-
148
-
149
-
150
-
151
-
152
-
153
-
154
-
155
-
156
-
157
-
158
-
159
-
160
-
161
-
162
-
163
-
164
-
165
-
166
-
167
-
168
-
169
-
170
-
171
-
172
-
173
-
174
-
175
-
176
-
177
-
178
-
179
-
180
-
181
-
182
-
183
-
184
-
185
-
186
-
187
-
188
-
189
-
190
-
191
-
192
-
193
-
194
-
195
-
196
-
197
-
198
-
199
-
200
-
201
-
202
-
203
-
204
-
205
-
206
-
207
-
208
-
209
-
210
-
211
-
212
-
213
-
214
-
215
-
216
-
217
-
218
-
219
-
220
-
221
-
222
-
223
-
224
-
225
 |
 |

Table of Contents
Comparable sales growth in EMEA/APAC reflected positive sales performance in all major countries in this segment for fiscal
2008. Strong comparable sales were driven primarily by continued growth in EMEA due to our continued focus on operational
improvements, marketing and advertising, and on high quality indulgent offerings, such as the limited time offer Angry Whopper
sandwich and Aberdeen Angus Burger, the continued success of the King Ahorro value menu in Spain and the BK Fusion Real Dairy
Ice Cream offerings in the U.K.
Latin America demonstrated strong results in comparable sales for fiscal 2008 compared to fiscal 2007. The improvement in
comparable sales reflects continued strength in Central America and South America, driven by sales of higher margin indulgent
products, such as the Steakhouse Burger, Extreme Whopper sandwich and BK Stacker sandwich and Whopper sandwich limited time
offers. In addition, promotional tie−ins with global marketing properties, such as The Simpsons tm Movie, Transformerstm, Scooby Dootm,
Snoopy®, Indiana Jonestm and the Kingdom of the Crystal Skulltm and Iron Mantm as well as combo meal offerings also drove sales. This
increase was partially offset by softer performance in Puerto Rico due to current economic conditions in that U.S. territory as well as the
introduction of a VAT tax which has negatively affected disposable income.
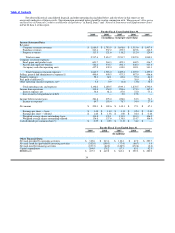
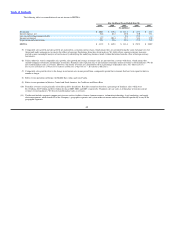
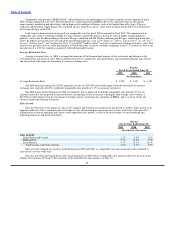
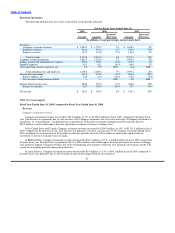
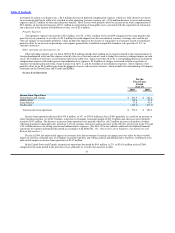
Average Restaurant Sales
Average restaurant sales, or ARS, is an important measure of the financial performance of our restaurants and changes in the
overall direction and trends of sales. ARS is influenced mostly by comparable sales performance and restaurant openings and closures
and also includes the impact of movement in currency exchange rates.
For the
Fiscal Years Ended June 30,
2009 2008 2007
(In thousands)
Average Restaurant Sales $ 1,259 $ 1,301 $ 1,193
Our ARS decreased during fiscal 2009, primarily a result of a $55,000 unfavorable impact from the movement of currency
exchange rates, partially offset by worldwide comparable sales growth of 1.2% (in constant currencies).
Our ARS improvement during fiscal 2008 was primarily due to improved worldwide comparable sales growth of 5.4% (in
constant currencies) for the period as discussed above, the opening of new restaurants with higher than average sales volumes, a
$32,000 favorable impact from the movement of foreign currency exchange rates, primarily in EMEA, and, to a lesser extent, the
closure of under−performing restaurants.
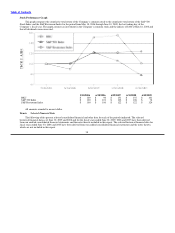
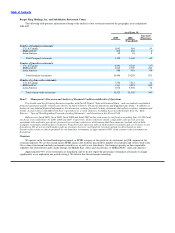
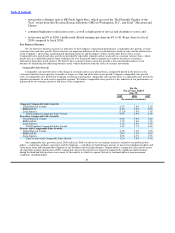
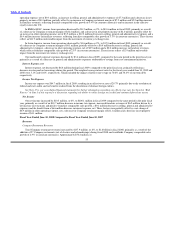
Sales Growth
Sales growth refers to the change in sales at all Company and franchise restaurants from one period to another. Sales growth is an
important indicator of the overall direction and trends of sales and income from operations on a system−wide basis. Sales growth is
influenced by restaurant openings and closures and comparable sales growth, as well as the effectiveness of our advertising and
marketing initiatives and featured products.
For the
Fiscal Years Ended June 30,
2009 2008 2007
(In constant currencies)
Sales Growth:
United States and Canada 1.2% 6.0% 3.0%
EMEA/APAC 9.7% 12.6% 7.9%
Latin America 8.5% 13.1% 13.3%
Total System−wide Sales Growth 4.2% 8.3% 4.9%
Sales growth continued on a positive trend during fiscal 2009 and 2008, as comparable sales and restaurant count continued to
increase on a system−wide basis.
Our sales growth in the United States and Canada during fiscal 2009 reflects comparable sales growth and the net increase in the
number of restaurants. We had 7,534 restaurants in the United States and Canada as of June 30,
48