Burger King 2009 Annual Report Download - page 90
Download and view the complete annual report
Please find page 90 of the 2009 Burger King annual report below. You can navigate through the pages in the report by either clicking on the pages listed below, or by using the keyword search tool below to find specific information within the annual report.-
 1
1 -
2
-
3
-
4
-
5
-
6
-
7
-
8
-
9
-
10
-
11
-
12
-
13
-
14
-
15
-
16
-
17
-
18
-
19
-
20
-
21
-
22
-
23
-
24
-
25
-
26
-
27
-
28
-
29
-
30
-
31
-
32
-
33
-
34
-
35
-
36
-
37
-
38
-
39
-
40
-
41
-
42
-
43
-
44
-
45
-
46
-
47
-
48
-
49
-
50
-
51
-
52
-
53
-
54
-
55
-
56
-
57
-
58
-
59
-
60
-
61
-
62
-
63
-
64
-
65
-
66
-
67
-
68
-
69
-
70
-
71
-
72
-
73
-
74
-
75
-
76
-
77
-
78
-
79
-
 80
80 -
 81
81 -
 82
82 -
 83
83 -
 84
84 -
 85
85 -
 86
86 -
 87
87 -
 88
88 -
 89
89 -
 90
90 -
 91
91 -
 92
92 -
 93
93 -
 94
94 -
 95
95 -
 96
96 -
 97
97 -
 98
98 -
 99
99 -
 100
100 -
101
-
102
-
103
-
104
-
105
-
106
-
107
-
108
-
109
-
110
-
111
-
112
-
113
-
114
-
115
-
116
-
117
-
118
-
119
-
120
-
121
-
122
-
123
-
124
-
125
-
126
-
127
-
128
-
129
-
130
-
131
-
132
-
133
-
134
-
135
-
136
-
137
-
138
-
139
-
140
-
141
-
142
-
143
-
144
-
145
-
146
-
147
-
148
-
149
-
150
-
151
-
152
-
153
-
154
-
155
-
156
-
157
-
158
-
159
-
160
-
161
-
162
-
163
-
164
-
165
-
166
-
167
-
168
-
169
-
170
-
171
-
172
-
173
-
174
-
175
-
176
-
177
-
178
-
179
-
180
-
181
-
182
-
183
-
184
-
185
-
186
-
187
-
188
-
189
-
190
-
191
-
192
-
193
-
194
-
195
-
196
-
197
-
198
-
199
-
200
-
201
-
202
-
203
-
204
-
205
-
206
-
207
-
208
-
209
-
210
-
211
-
212
-
213
-
214
-
215
-
216
-
217
-
218
-
219
-
220
-
221
-
222
-
223
-
224
-
225
 |
 |

Table of Contents
BURGER KING HOLDINGS, INC. AND SUBSIDIARIES
Notes to Consolidated Financial Statements — (Continued)
method, the Company has determined that 6.25 years is an appropriate expected term for awards with four−year graded vesting and
6.50 years for awards with five−year grading vesting.
Upon the adoption of SFAS No. 123R, the Company utilized a volatility assumption in the option pricing model to calculate the
grant date fair value of stock options. However, as a newly public company, the Company had previously elected, for stock options
granted subsequent to the adoption of SFAS No. 123R, to base the estimate of the expected volatility of its common stock for the
Black−Scholes model solely on the historical volatility of a group of its peers, as permitted under SFAS No. 123R and SAB No. 107.
Beginning in 2008, the Company determined it had sufficient information regarding the historical volatility of its common stock price
and implied volatility of its exchange−traded options to incorporate a portion of these volatilities into the calculation of expected
volatility used in the Black−Scholes model, in addition to the historical volatility of a group of its peers.
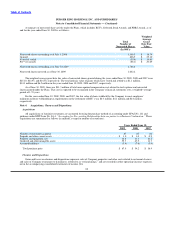
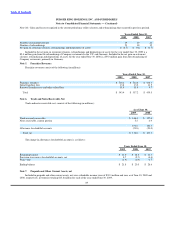
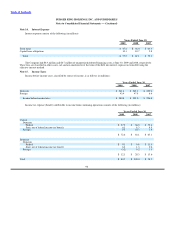
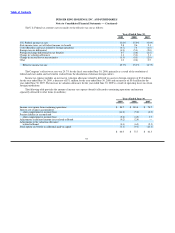
The fair value of each stock option granted under the Plans during the years ended June 30, 2009, 2008, and 2007 was estimated
on the date of grant using the Black−Scholes option pricing model based on the following weighted−average assumptions:
Years Ended June 30,
2009 2008 2007
Risk−free interest rate 3.33% 4.40% 5.34%
Expected term (in years) 6.25 6.25 6.25
Expected volatility 31.80% 29.35% 33.01%
Expected dividend yield 0.96% 1.07% 0.00%
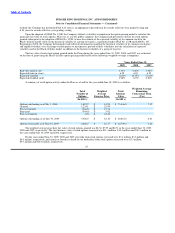
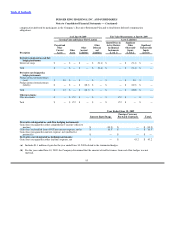
A summary of stock option activity under the Plans as of and for the year ended June 30, 2009 is as follows:
Weighted Average
Total Weighted Total Remaining
Number of Average Intrinsic Contractual Term
Options Exercise Price Value (Yrs)
(In 000’s) (In 000’s)
Options outstanding as of July 1, 2008 5,425.2 $ 12.89 $ 75,446.0 7.15
Granted 1,234.1 $ 25.99
Pre−vest cancels (166.5) $ 19.71
Exercised (564.0) $ 5.62
Post−vest cancels (2.8) $ 22.42
Options outstanding as of June 30, 2009 5,926.0 $ 16.10 $ 26,861.4 6.83
Options exercisable as of June 30, 2009 2,866.7 $ 10.37 $ 22,749.0 5.62
The weighted average grant date fair value of stock options granted was $8.54, $7.99 and $6.71 in the years ended June 30, 2009,
2008 and 2007, respectively. The total intrinsic value of stock options exercised was $11.4 million, $14.4 million and $30.5 million in
the years ended June 30, 2009 and 2008, respectively.
For the years ended June 30, 2009, 2008 and 2007, proceeds from stock options exercised were $3.1 million, $3.8 million and
$9.0 million, respectively, and actual tax benefits realized for tax deductions from stock options exercised were $3.3 million,
$9.3 million and $14.0 million, respectively.
87