Burger King 2009 Annual Report Download - page 109
Download and view the complete annual report
Please find page 109 of the 2009 Burger King annual report below. You can navigate through the pages in the report by either clicking on the pages listed below, or by using the keyword search tool below to find specific information within the annual report.-
 1
1 -
2
-
3
-
4
-
5
-
6
-
7
-
8
-
9
-
10
-
11
-
12
-
13
-
14
-
15
-
16
-
17
-
18
-
19
-
20
-
21
-
22
-
23
-
24
-
25
-
26
-
27
-
28
-
29
-
30
-
31
-
32
-
33
-
34
-
35
-
36
-
37
-
38
-
39
-
40
-
41
-
42
-
43
-
44
-
45
-
46
-
47
-
48
-
49
-
50
-
51
-
52
-
53
-
54
-
55
-
56
-
57
-
58
-
59
-
60
-
61
-
62
-
63
-
64
-
65
-
66
-
67
-
68
-
69
-
70
-
71
-
72
-
73
-
74
-
75
-
76
-
77
-
78
-
79
-
80
-
81
-
82
-
83
-
84
-
85
-
86
-
87
-
88
-
89
-
90
-
91
-
92
-
93
-
94
-
95
-
96
-
97
-
98
-
 99
99 -
 100
100 -
 101
101 -
 102
102 -
 103
103 -
 104
104 -
 105
105 -
 106
106 -
 107
107 -
 108
108 -
 109
109 -
 110
110 -
 111
111 -
 112
112 -
 113
113 -
 114
114 -
 115
115 -
 116
116 -
 117
117 -
 118
118 -
 119
119 -
120
-
121
-
122
-
123
-
124
-
125
-
126
-
127
-
128
-
129
-
130
-
131
-
132
-
133
-
134
-
135
-
136
-
137
-
138
-
139
-
140
-
141
-
142
-
143
-
144
-
145
-
146
-
147
-
148
-
149
-
150
-
151
-
152
-
153
-
154
-
155
-
156
-
157
-
158
-
159
-
160
-
161
-
162
-
163
-
164
-
165
-
166
-
167
-
168
-
169
-
170
-
171
-
172
-
173
-
174
-
175
-
176
-
177
-
178
-
179
-
180
-
181
-
182
-
183
-
184
-
185
-
186
-
187
-
188
-
189
-
190
-
191
-
192
-
193
-
194
-
195
-
196
-
197
-
198
-
199
-
200
-
201
-
202
-
203
-
204
-
205
-
206
-
207
-
208
-
209
-
210
-
211
-
212
-
213
-
214
-
215
-
216
-
217
-
218
-
219
-
220
-
221
-
222
-
223
-
224
-
225
 |
 |

Table of Contents
BURGER KING HOLDINGS, INC. AND SUBSIDIARIES
Notes to Consolidated Financial Statements — (Continued)
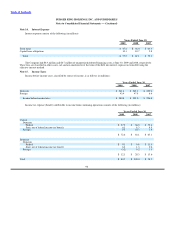
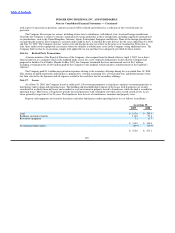
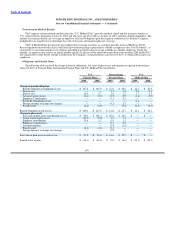
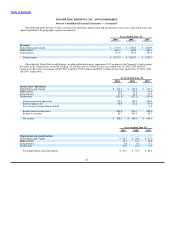
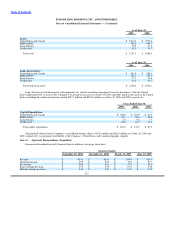
Other Changes in Plan Assets and Projected Benefit Obligation Recognized in Other Comprehensive Income
International U.S. Medical
U.S. Pension Plans Pension Plans Plan
2009 2008 2009 2008 2009 2008
Unrecognized actuarial (gain) loss $ 24.1 $ 8.4 $ 0.4 $ 4.0 $ (1.5) $ (0.8)
Total recognized in OCI $ 24.1 $ 8.4 $ 0.4 $ 4.0 $ (1.5) $ (0.8)
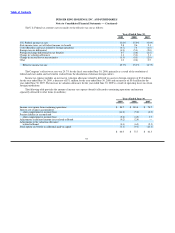
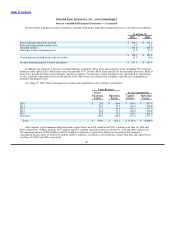
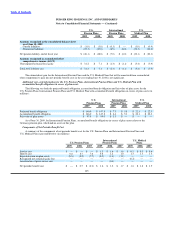
Assumptions
The weighted−average assumptions used in computing the benefit obligations of the U.S. Pension Plans and U.S. Medical Plan are
as follows:
International U.S. Medical
U.S. Pension Plans Pension Plans Plan
2009 2008 2007 2009 2008 2007 2009 2008 2007
Discount rate as of
year−end 6.37% 6.10% 6.07% 6.00% 6.10% 5.64% 6.37% 6.10% 6.07%
Range of compensation
rate increase N/A* N/A* N/A* 3.53% 4.15% 3.60% N/A N/A N/A
* The Company curtailed the U.S Pension Plans during the year ended June 30, 2006.
The discount rate used in the calculation of the benefit obligation at June 30, 2009 for the U.S. Plans is derived from a yield curve
comprised of the yields of an index of 250 equally−weighted corporate bonds, rated AA or better by Moody’s, which approximates the
duration of the U.S. Plans.
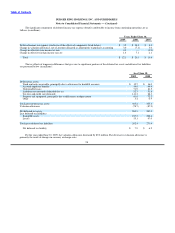
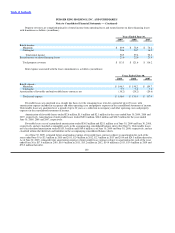
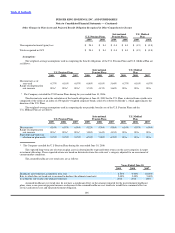
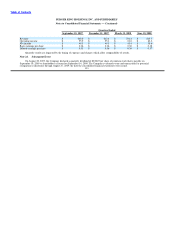
The weighted−average assumptions used in computing the net periodic benefit cost of the U.S. Pension Plans and the
U.S. Medical Plan are as follows:
International U.S. Medical
U.S. Pension Plans Pension Plans Plan
2009 2008 2007 2009 2008 2007 2009 2008 2007
Discount rate 6.10% 6.07% 6.09% 5.82% 5.39% 5.08% 6.10% 6.07% 6.09%
Range of compensation
rate increase N/A* N/A* N/A* 3.88% 3.61% 4.18% N/A N/A N/A
Expected long−term rate
of return on plan assets 8.25% 8.25% 8.25% 6.51% 7.00% 6.70% N/A N/A N/A
* The Company curtailed the U.S Pension Plans during the year ended June 30, 2006.
The expected long−term rate of return on plan assets is determined by expected future returns on the asset categories in target
investment allocation. These expected returns are based on historical returns for each asset’s category adjusted for an assessment of
current market conditions.
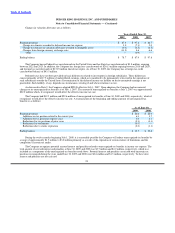
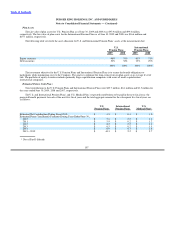
The assumed healthcare cost trend rates are as follows:
Years Ended June 30,
2009 2008 2007
Healthcare cost trend rate assumed for next year 8.50% 9.00% 10.00%
Rate to which the cost trend rate is assumed to decline (the ultimate trend rate) 5.00% 5.00% 5.00%
Year that the rate reaches the ultimate trend rate 2016 2016 2016
Assumed healthcare cost trend rates do not have a significant effect on the amounts reported for the postretirement healthcare
plans, since a one−percentage point increase or decrease in the assumed healthcare cost trend rate would have a minimal effect on
service and interest cost and the postretirement obligation.
106