Burger King 2009 Annual Report Download - page 66
Download and view the complete annual report
Please find page 66 of the 2009 Burger King annual report below. You can navigate through the pages in the report by either clicking on the pages listed below, or by using the keyword search tool below to find specific information within the annual report.-
 1
1 -
2
-
3
-
4
-
5
-
6
-
7
-
8
-
9
-
10
-
11
-
12
-
13
-
14
-
15
-
16
-
17
-
18
-
19
-
20
-
21
-
22
-
23
-
24
-
25
-
26
-
27
-
28
-
29
-
30
-
31
-
32
-
33
-
34
-
35
-
36
-
37
-
38
-
39
-
40
-
41
-
42
-
43
-
44
-
45
-
46
-
47
-
48
-
49
-
50
-
51
-
52
-
53
-
54
-
55
-
 56
56 -
 57
57 -
 58
58 -
 59
59 -
 60
60 -
 61
61 -
 62
62 -
 63
63 -
 64
64 -
 65
65 -
 66
66 -
 67
67 -
 68
68 -
 69
69 -
 70
70 -
 71
71 -
 72
72 -
 73
73 -
 74
74 -
 75
75 -
 76
76 -
77
-
78
-
79
-
80
-
81
-
82
-
83
-
84
-
85
-
86
-
87
-
88
-
89
-
90
-
91
-
92
-
93
-
94
-
95
-
96
-
97
-
98
-
99
-
100
-
101
-
102
-
103
-
104
-
105
-
106
-
107
-
108
-
109
-
110
-
111
-
112
-
113
-
114
-
115
-
116
-
117
-
118
-
119
-
120
-
121
-
122
-
123
-
124
-
125
-
126
-
127
-
128
-
129
-
130
-
131
-
132
-
133
-
134
-
135
-
136
-
137
-
138
-
139
-
140
-
141
-
142
-
143
-
144
-
145
-
146
-
147
-
148
-
149
-
150
-
151
-
152
-
153
-
154
-
155
-
156
-
157
-
158
-
159
-
160
-
161
-
162
-
163
-
164
-
165
-
166
-
167
-
168
-
169
-
170
-
171
-
172
-
173
-
174
-
175
-
176
-
177
-
178
-
179
-
180
-
181
-
182
-
183
-
184
-
185
-
186
-
187
-
188
-
189
-
190
-
191
-
192
-
193
-
194
-
195
-
196
-
197
-
198
-
199
-
200
-
201
-
202
-
203
-
204
-
205
-
206
-
207
-
208
-
209
-
210
-
211
-
212
-
213
-
214
-
215
-
216
-
217
-
218
-
219
-
220
-
221
-
222
-
223
-
224
-
225
 |
 |

Table of Contents
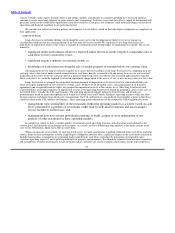
sources. Volatile credit, equity, foreign currency and energy markets, and declines in consumer spending have increased and may
continue to create uncertainty inherent in such estimates and assumptions. As future events and their effects cannot be determined with
precision, actual results could differ significantly from these estimates. Changes in our estimates could materially impact our results of
operations and financial condition in any particular period.
We consider our critical accounting policies and estimates to be as follows based on the high degree of judgment or complexity in
their application:
Long−lived Assets
Long−lived assets (including definite−lived intangible assets) are tested for impairment whenever events or changes in
circumstances indicate that the carrying amount of an asset may not be recoverable. We regularly review long−lived assets for
indications of impairment. Some of the events or changes in circumstances that would trigger an impairment test include, but are not
limited to:
• significant under−performance relative to expected and/or historical results (negative comparable sales or
cash flows for two consecutive years);
• significant negative industry or economic trends; or
• knowledge of transactions involving the sale of similar property at amounts below our carrying value.
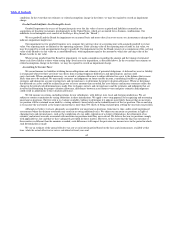
The impairment test for long−lived assets requires us to assess the recoverability of our long−lived assets by comparing their net
carrying value to the sum of undiscounted estimated future cash flows directly associated with and arising from our use and eventual
disposition of the assets. If the net carrying value of a group of long−lived assets exceeds the sum of related undiscounted estimated
future cash flows, we would be required to record an impairment charge equal to the excess, if any, of net carrying value over fair value.
Long−lived assets are grouped for recognition and measurement of impairment at the lowest level for which identifiable cash
flows are largely independent of the cash flows of other assets. Definite−lived intangible assets, consisting primarily of franchise
agreements and reacquired franchise rights, are grouped for impairment reviews at the country level. Other long−lived assets and
related liabilities are grouped together for impairment reviews at the operating market level (based on geographic areas) in the case of
the United States, Canada, the U.K. and Germany. The operating market groupings within the United States and Canada are
predominantly based on major metropolitan areas within the United States and Canada. Similarly, operating markets within the other
foreign countries with larger long−lived asset concentrations (the U.K. and Germany) are made up of geographic regions within those
countries (three in the U.K. and four in Germany). These operating market definitions are based upon the following primary factors:
• management views profitability of the restaurants within the operating markets as a whole, based on cash
flows generated by a portfolio of restaurants, rather than by individual restaurants and area managers
receive incentives on this basis; and
• management does not evaluate individual restaurants to build, acquire or close independent of any
analysis of other restaurants in these operating markets.
In countries in which we have a smaller number of restaurants most operating functions and advertising are performed at the
country level, and shared by all restaurants in the country. As a result, we have defined operating markets as the entire country in the
case of The Netherlands, Spain, Italy, Mexico and China.
When assessing the recoverability of our long−lived assets, we make assumptions regarding estimated future cash flows and other
factors. Some of these assumptions involve a high degree of judgment and also bear a significant impact on the assessment conclusions.
Included among these assumptions are estimating undiscounted future cash flows, including the projection of comparable sales,
restaurant operating expenses, and capital requirements for property and equipment. We formulate estimates from historical experience
and assumptions of future performance, based on business plans and forecasts, recent economic and business trends, and competitive
64