Burger King 2009 Annual Report Download - page 61
Download and view the complete annual report
Please find page 61 of the 2009 Burger King annual report below. You can navigate through the pages in the report by either clicking on the pages listed below, or by using the keyword search tool below to find specific information within the annual report.-
 1
1 -
2
-
3
-
4
-
5
-
6
-
7
-
8
-
9
-
10
-
11
-
12
-
13
-
14
-
15
-
16
-
17
-
18
-
19
-
20
-
21
-
22
-
23
-
24
-
25
-
26
-
27
-
28
-
29
-
30
-
31
-
32
-
33
-
34
-
35
-
36
-
37
-
38
-
39
-
40
-
41
-
42
-
43
-
44
-
45
-
46
-
47
-
48
-
49
-
50
-
 51
51 -
 52
52 -
 53
53 -
 54
54 -
 55
55 -
 56
56 -
 57
57 -
 58
58 -
 59
59 -
 60
60 -
 61
61 -
 62
62 -
 63
63 -
 64
64 -
 65
65 -
 66
66 -
 67
67 -
 68
68 -
 69
69 -
 70
70 -
 71
71 -
72
-
73
-
74
-
75
-
76
-
77
-
78
-
79
-
80
-
81
-
82
-
83
-
84
-
85
-
86
-
87
-
88
-
89
-
90
-
91
-
92
-
93
-
94
-
95
-
96
-
97
-
98
-
99
-
100
-
101
-
102
-
103
-
104
-
105
-
106
-
107
-
108
-
109
-
110
-
111
-
112
-
113
-
114
-
115
-
116
-
117
-
118
-
119
-
120
-
121
-
122
-
123
-
124
-
125
-
126
-
127
-
128
-
129
-
130
-
131
-
132
-
133
-
134
-
135
-
136
-
137
-
138
-
139
-
140
-
141
-
142
-
143
-
144
-
145
-
146
-
147
-
148
-
149
-
150
-
151
-
152
-
153
-
154
-
155
-
156
-
157
-
158
-
159
-
160
-
161
-
162
-
163
-
164
-
165
-
166
-
167
-
168
-
169
-
170
-
171
-
172
-
173
-
174
-
175
-
176
-
177
-
178
-
179
-
180
-
181
-
182
-
183
-
184
-
185
-
186
-
187
-
188
-
189
-
190
-
191
-
192
-
193
-
194
-
195
-
196
-
197
-
198
-
199
-
200
-
201
-
202
-
203
-
204
-
205
-
206
-
207
-
208
-
209
-
210
-
211
-
212
-
213
-
214
-
215
-
216
-
217
-
218
-
219
-
220
-
221
-
222
-
223
-
224
-
225
 |
 |

Table of Contents
and $8.0 million in miscellaneous cost savings and other items, including decreased insurance costs and an increase in the amount of
capitalized indirect labor costs on capital projects. Annual stock−based compensation expense is expected to increase through fiscal
year 2010, as a result of our adoption of Financial Accounting Standards Board (“FASB”) Statement of Financial Accounting Standards
(“SFAS”) No. 123R, “Share−based Payment” in fiscal 2007, which has resulted in stock−based compensation expense only for awards
granted subsequent to our initial public offering. See Note 3 to our Consolidated Financial Statements in Part II, Item 8 of this
Form 10−K for further information regarding our stock−based compensation.
Property Expenses
Property expenses increased by $1.5 million, or 2%, to $62.1 million in fiscal 2008, primarily as a result of an increase in
contingent rent expense generated by comparable sales growth in the United States and Canada, as well as a $1.6 million unfavorable
impact from the movement of foreign currency exchange rates in EMEA. These increases were partially offset by a net reduction in the
number of properties we lease or sublease to franchisees in EMEA. Property expenses were 37% of property revenues in the United
States and Canada in both fiscal 2008 and fiscal 2007. Our property expenses in EMEA/APAC approximate our property revenues
because most of the EMEA/APAC property operations consist of properties that are subleased to franchisees on a pass−through basis.
Other Operating (Income) Expense, Net
Other operating (income) expense, net was $0.9 million of expense in fiscal 2008, compared to $4.4 million of income in fiscal
2007. Other operating expense, net in fiscal 2008 includes $4.2 million of franchise system distress costs in the U.K., $1.6 million of
foreign currency transaction losses, $1.9 million of charges associated with the acquisition of franchise restaurants, $1.0 million in
charges for litigation reserves and a loss of $0.7 million from forward currency contracts used to hedge intercompany loans
denominated in foreign currencies. These costs were partially offset by net gains of $9.8 million from the disposal of assets and
restaurant closures, primarily in Germany and the United States, which includes the refranchising of Company restaurants in Germany.
Other operating income, net in fiscal 2007 included a net gain of $4.7 million from the disposal of assets and a gain of $6.8 million
from forward currency contracts used to hedge intercompany loans denominated in foreign currencies, partially offset by $6.6 million in
costs associated with the termination of the Coral Gables Lease, $1.7 million in charges for litigation reserves and $2.9 million in
franchise workout costs.
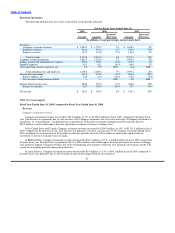
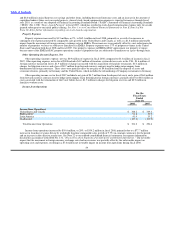
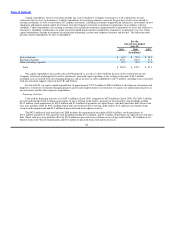
Income from Operations
For the
Fiscal Years
Ended
June 30,
2008 2007
Income from Operations:
United States and Canada $ 348.2 $ 339.4
EMEA/APAC 91.8 53.9
Latin America 41.4 35.2
Unallocated (127.2) (133.9)
Total Income from Operations $ 354.2 $ 294.6
Income from operations increased by $59.6 million, or 20%, to $354.2 million in fiscal 2008, primarily due to a $77.7 million
increase in franchise revenues driven by worldwide franchise comparable sales growth of 5.7% (in constant currencies) for the period
and an increase in the effective royalty rate. See Note 22 to our audited consolidated financial statements for segment information
disclosed in accordance with SFAS No. 131, “Disclosures about Segments of an Enterprise and Related Information.” The favorable
impact that the movement in foreign currency exchange rates had on revenues was partially offset by the unfavorable impact on
operating costs and expenses, resulting in a $7.6 million net favorable impact on income from operations during fiscal 2008.
59