Burger King 2009 Annual Report Download - page 46
Download and view the complete annual report
Please find page 46 of the 2009 Burger King annual report below. You can navigate through the pages in the report by either clicking on the pages listed below, or by using the keyword search tool below to find specific information within the annual report.-
 1
1 -
2
-
3
-
4
-
5
-
6
-
7
-
8
-
9
-
10
-
11
-
12
-
13
-
14
-
15
-
16
-
17
-
18
-
19
-
20
-
21
-
22
-
23
-
24
-
25
-
26
-
27
-
28
-
29
-
30
-
31
-
32
-
33
-
34
-
35
-
 36
36 -
 37
37 -
 38
38 -
 39
39 -
 40
40 -
 41
41 -
 42
42 -
 43
43 -
 44
44 -
 45
45 -
 46
46 -
 47
47 -
 48
48 -
 49
49 -
 50
50 -
 51
51 -
 52
52 -
 53
53 -
 54
54 -
 55
55 -
 56
56 -
57
-
58
-
59
-
60
-
61
-
62
-
63
-
64
-
65
-
66
-
67
-
68
-
69
-
70
-
71
-
72
-
73
-
74
-
75
-
76
-
77
-
78
-
79
-
80
-
81
-
82
-
83
-
84
-
85
-
86
-
87
-
88
-
89
-
90
-
91
-
92
-
93
-
94
-
95
-
96
-
97
-
98
-
99
-
100
-
101
-
102
-
103
-
104
-
105
-
106
-
107
-
108
-
109
-
110
-
111
-
112
-
113
-
114
-
115
-
116
-
117
-
118
-
119
-
120
-
121
-
122
-
123
-
124
-
125
-
126
-
127
-
128
-
129
-
130
-
131
-
132
-
133
-
134
-
135
-
136
-
137
-
138
-
139
-
140
-
141
-
142
-
143
-
144
-
145
-
146
-
147
-
148
-
149
-
150
-
151
-
152
-
153
-
154
-
155
-
156
-
157
-
158
-
159
-
160
-
161
-
162
-
163
-
164
-
165
-
166
-
167
-
168
-
169
-
170
-
171
-
172
-
173
-
174
-
175
-
176
-
177
-
178
-
179
-
180
-
181
-
182
-
183
-
184
-
185
-
186
-
187
-
188
-
189
-
190
-
191
-
192
-
193
-
194
-
195
-
196
-
197
-
198
-
199
-
200
-
201
-
202
-
203
-
204
-
205
-
206
-
207
-
208
-
209
-
210
-
211
-
212
-
213
-
214
-
215
-
216
-
217
-
218
-
219
-
220
-
221
-
222
-
223
-
224
-
225
 |
 |

Table of Contents
mix is beneficial to us because the capital required to grow and maintain our system is funded primarily by franchisees while giving us
a sizable base of company restaurants to demonstrate credibility with franchisees in launching new initiatives. However, our franchise
dominated business model also presents a number of drawbacks and risks, such as our limited influence over franchisees and limited
ability to facilitate changes in restaurant ownership. In addition, our operating results are closely tied to the success of our franchisees,
and we are dependent on franchisees to open new restaurants and remodel their existing restaurants as part of our growth strategy.
Our international operations are impacted by fluctuations in currency exchange rates. In Company markets located outside of the
U.S., we generate revenues and incur expenses denominated in local currencies. These revenues and expenses are translated using the
average rates during the period in which they are recognized, and are impacted by changes in currency exchange rates. In many of our
franchise markets, our franchisees pay royalties to us in currencies other than the local currency in which they operate; however, as the
royalties are calculated based on local currency sales, our revenues are still impacted by fluctuations in currency exchange rates.
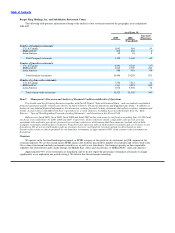
Revenues
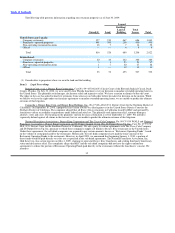
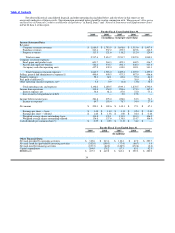
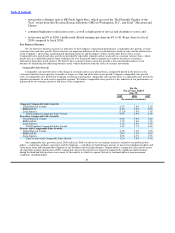
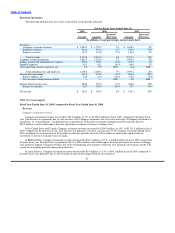
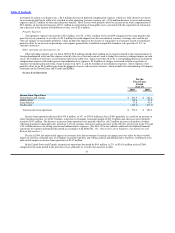
In fiscal 2009, segment revenues and income from operations, excluding unallocated corporate general and administrative
expenses, were allocated as follows:
Revenues Income from Operations
Segment:
U.S. & Canada 69% 74%
EMEA/APAC 27% 18%
Latin America 4% 8%
Total 100% 100%
We generate revenues from three sources: retail sales at Company restaurants; franchise revenues, consisting of royalties based on
a percentage of sales reported by franchise restaurants and franchise fees paid to us by our franchisees; and property income from
restaurants that we lease or sublease to franchisees. In fiscal 2009, Company restaurant revenues and franchise revenues represented
74% and 21% of total revenues, respectively. The remaining 5% of total revenues was derived from property income.
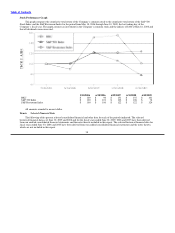
Restaurant sales are typically higher in the spring and summer months (our fourth and first fiscal quarters) when the weather is
warmer than in the fall and winter months (our second and third fiscal quarters). Restaurant sales during the winter are typically highest
in December, during the holiday shopping season. Our restaurant sales and Company restaurant margin are typically lowest during our
third fiscal quarter, which occurs during the winter months and includes February, the shortest month of the year.
Our sales are heavily influenced by brand advertising, menu selection and initiatives to improve restaurant operations. Company
restaurant revenues are affected by comparable sales, timing of Company restaurant openings and closures, acquisitions by us of
franchise restaurants and sales of Company restaurants to franchisees, or “refranchisings.” In fiscal 2009, franchise restaurants
generated 87% of system−wide sales. We do not record franchise sales as revenues. However, royalties paid by franchisees are based on
a percentage of franchise sales and are recorded as franchise revenues.
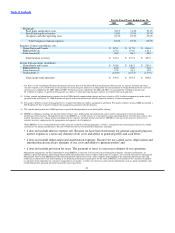
Expenses
Company restaurants incur three types of operating expenses: (i) food, paper and other product costs, which represent the costs of
the products that we sell to customers in Company restaurants; (ii) payroll and employee benefits costs, which represent the wages paid
to Company restaurant managers and staff, as well as the cost of their health insurance, other benefits and training; and (iii) occupancy
and other operating costs, which represent all other direct costs of operating our Company restaurants, including the cost of rent or real
estate depreciation (for restaurant properties owned by us), depreciation on equipment, repairs and maintenance, insurance, restaurant
supplies and utilities. As average restaurant sales increase, we can leverage payroll and employee benefits costs and occupancy and
other costs, resulting in a direct improvement in restaurant profitability. As a result, we believe our
44